Chapter 18. Transcript Models, Isoforms, Genome Browsers, and Annotation Versioning
Scope Note
This chapter explains how transcript models describe RNA products on reference genomes, how isoforms are defined and supported, how genome browsers and annotation databases represent evidence, and why versioning is part of reproducible RNA biology. A transcript model is an annotation object: it states that a particular RNA product is expected to occupy particular genomic intervals on a particular strand, with particular exons, introns, ends, untranslated regions, coding segments, identifiers, and evidence. The model is not the RNA molecule itself. It is a structured claim about a molecule, built from experiments, computational inference, and curation.
Transcript models matter because nearly every downstream statement about RNA depends on them. A differential-expression result depends on which exons or transcripts were counted. A splicing result depends on which junctions were considered possible. A modification, structure, localization, ribosome-profiling, proteomics, or disease-association claim depends on which isoform received the signal. A genome-browser observation depends on an assembly, a track, a coordinate system, and a database release. When transcript models are cited imprecisely, biological claims become difficult to reproduce.
This chapter focuses on transcript representation and evidence standards, not on the full molecular mechanisms of transcription initiation, splicing, 3′ end formation, RNA decay, or transcriptome assembly algorithms. Chapter 15 covers promoters, enhancers, terminators, operons, and transcription units. Chapters 26-30 cover capping, splicing, polyadenylation, and mRNP identity. Chapters 122-139 cover RNA measurement artifacts and method standards. Chapter 90 covers long noncoding RNA annotation problems. Chapter 141 covers transcriptome assembly, isoform quantification, and annotation updating. Chapter 19 covers RNA databases and entity resolution more broadly.
Executive Summary
A transcript model is an evidence-backed annotation of an RNA product. For a simple protein-coding mRNA, a transcript model usually records the chromosome or scaffold, strand, transcription start site, exons, introns, coding sequence, untranslated regions, transcript end, gene and transcript identifiers, biotype, and supporting evidence. For noncoding and small RNAs, the same general principle applies, but the relevant mature molecule, precursor, processing product, and locus can be different objects. A transcript model therefore must be read as a curated representation, not as a direct observation of every RNA molecule in the cell.
Transcript boundaries are biologically meaningful. The 5′ boundary can determine whether an mRNA contains a long or short 5′ untranslated region, upstream open reading frames, RNA structures, regulatory motifs, or alternative first exons. A primary study showing that sites of transcription initiation can drive mRNA isoform selection illustrates that a transcription start site can influence downstream transcript architecture rather than merely label the first nucleotide. The 3′ boundary can determine the length and content of the 3′ untranslated region, expose or remove regulatory motifs, change the terminal coding exon, and alter polyadenylation-site usage. PolyA_DB v4 illustrates how 3′ end sequencing and long-read evidence can revise poly(A) site and isoform annotation in human and mouse genomes.
An isoform is a distinguishable RNA product from a gene, locus, or transcription unit. Isoforms can differ by transcription start site, exon inclusion, splice junction, intron retention, alternative first or last exon, coding sequence, untranslated region, polyadenylation site, or transcript termination. The key pedagogical caution is that isoform detection is not the same as functional validation. A junction read supports a local splicing event. A full-length long read supports a molecule-like transcript structure. Ribosome profiling or proteomics may support translation. Perturbation or genetics is needed for a strong mechanistic function claim. The evidence level must match the biological claim.
Genome browsers and annotation databases are not interchangeable truth sources. They are organized ways to view, store, and distribute evidence. GENCODE, RefSeq, Ensembl, UCSC, and organism-specific databases can represent overlapping loci with different transcript models because the resources use different releases, assemblies, evidence thresholds, curation policies, and identifier systems. The UCSC Genome Browser update papers provide a clear example of browser-track logic: a browser display is an assembly-based stack of tracks that may include gene annotations, RNA-seq signals, alignments, conservation, variants, repeats, regulatory marks, and user data.
File formats and coordinate systems are part of the science. GTF and GFF3 files represent genes, transcripts, exons, coding sequences, and related feature hierarchies. BED and bigBed often represent intervals and browser tracks. bigWig stores continuous signal. BAM and CRAM store aligned reads. FASTA stores sequences. These formats differ in coordinate conventions, feature hierarchies, strand handling, attributes, and identifier syntax. A one-nucleotide coordinate error can shift a splice donor, splice acceptor, start codon, stop codon, editing site, variant, primer site, or guide-RNA target.
Transcript models drift as evidence and curation change. A transcript may be extended, shortened, merged, split, reclassified, deprecated, promoted to a better support level, or moved during assembly updates. Drift is not inherently a defect; it is how living annotations improve. The reproducibility problem arises when a publication, assay, or clinical interpretation cites only a gene symbol, a screenshot, or an unversioned transcript name. Reproducible transcript analysis should record genome assembly, database source, annotation release, transcript and gene identifiers, version suffixes where available, coordinate convention, filters, source files, and enough evidence context to reconstruct the model.
Concept Inventory
- Transcript model: a structured annotation describing an RNA product on a reference genome. It commonly includes genomic coordinates, strand, exons, introns, ends, coding sequence if present, untranslated regions, identifiers, biotype, and evidence. A transcript model is not identical to the physical RNA. It can be wrong, incomplete, tissue-specific, obsolete, or revised.
- Isoform: a distinguishable RNA product from a gene, locus, or transcription unit. In common usage, “isoform” often means a splice isoform, but that narrow usage is incomplete. Isoforms can differ by start site, end site, exon content, retained intron, coding sequence, untranslated region, processing, or mature small-RNA product.
- Transcription start site: the genomic position where RNA synthesis begins. A 5′ read boundary is not automatically a transcription start site because it can also reflect processing, degradation, incomplete reverse transcription, or assembly heuristics.
- Transcript end: the 3′ boundary of a transcript model. For polyadenylated mRNAs, the end often reflects cleavage and polyadenylation, but “polyadenylation site” can mean either the cleavage site or the upstream signal sequence depending on the source.
- Exon: a segment retained in a processed transcript. An intron is a segment removed from a precursor by splicing. Exons can be coding or untranslated, and a retained intron may behave as part of a mature isoform, a nuclear-retained RNA, or a decay intermediate depending on context.
- Untranslated region: a transcribed region outside the main coding sequence of an mRNA. “Untranslated” does not mean unimportant. UTRs can contain upstream open reading frames, RNA structures, localization signals, miRNA sites, RNA-binding protein sites, modification sites, and decay elements.
- Transcript support level: a database-specific evidence assessment for a transcript model. Support level is evidence for the model’s structure or existence, not proof of biological function. GENCODE and Ensembl updates, together with MANE and APPRIS sources for matched or principal transcripts, illustrate why support labels, canonicality, and functional importance must be cited as resource-specific conventions rather than treated as universal biological categories.
- Genome assembly: a constructed reference sequence used as a coordinate system. Coordinates have no precise meaning without the assembly name and sequence namespace.
- Browser track: a displayed layer of annotation or data in a genome browser. Tracks can represent curated annotations, computational predictions, experimental signals, aligned reads, variation, conservation, repeats, or user-uploaded files.
- Coordinate system: defines how genomic positions and intervals:** counted. Common differences include 0-based versus 1-based indexing, half-open versus closed intervals, chromosome naming, strandedness, and whether coordinates refer to genomic DNA, cDNA, transcript sequence, or protein sequence.
- Versioned accession: an identifier with a version suffix that points to a specific sequence or annotation version. Omitting the suffix can obscure biologically important changes.
- Annotation release: a dated or numbered distribution of a database’s models and files. Release numbers are resource-specific: an Ensembl release, a GENCODE release, a RefSeq update, and a UCSC track update are not a single shared version system.
- Model drift: change in transcript models across database releases or assembly versions. Drift includes extension, truncation, merge, split, deprecation, reclassification, support-level change, and coordinate remapping.
- Obsolete annotation: a retired, replaced, merged, split, or superseded record. Obsolete annotations are still scientifically useful when reproducing older analyses.
What to Know Before Reading This Chapter
The reader should first distinguish a gene, a transcription unit, a primary transcript, and a mature RNA. A gene is a genomic locus or inherited unit associated with one or more products. A transcription unit is a region transcribed from a promoter to a termination or processing region. A primary transcript is the initial RNA product. A mature RNA is the processed molecule that accumulates, functions, or is measured. In eukaryotic protein-coding genes, the mature mRNA often differs from the primary transcript because introns are removed, a cap is added, and a 3′ end is cleaved and polyadenylated. In bacteria, organelles, and many noncoding RNA systems, processing and polycistronic transcription can make the gene-to-RNA relationship different from the canonical nuclear mRNA model.
The reader should also distinguish a sequence from an annotation. A reference genome provides sequence coordinates. An annotation says what biological feature is believed to occupy those coordinates. The same sequence assembly can receive updated annotations as new RNA evidence accumulates. Conversely, the same gene symbol can be mapped to different coordinates after an assembly update. When annotation and assembly are confused, a transcript statement that sounds precise can become unreproducible.
The reader should recognize that RNA evidence is method-dependent. Short-read RNA-seq can measure expression and splice junctions, but short reads often do not connect all exons in a molecule. Long-read RNA sequencing can connect distant exons and transcript ends, but long-read libraries can contain truncated molecules and platform-specific errors. Cap-analysis and 3′ end methods support transcript boundaries, but end-capture protocols have biases. Ribosome profiling supports ribosome occupancy, not automatically protein production. Proteomics supports peptides, not automatically all transcript boundaries. Perturbation supports function only if the perturbation distinguishes isoforms cleanly.
This chapter uses four recurring examples. First, transcription start site choice illustrates why 5′ boundaries can shape isoforms. Second, long-read RNA sequencing illustrates the difference between local junction evidence and molecule-level transcript evidence. Third, genome browsers illustrate why displays must be traced to assemblies, tracks, and versions. Fourth, poly(A)-site and small-RNA resources illustrate that transcript annotation is broader than the protein-coding mRNA model.
18.1. Transcription start sites, transcript ends, exons, introns, and UTR models
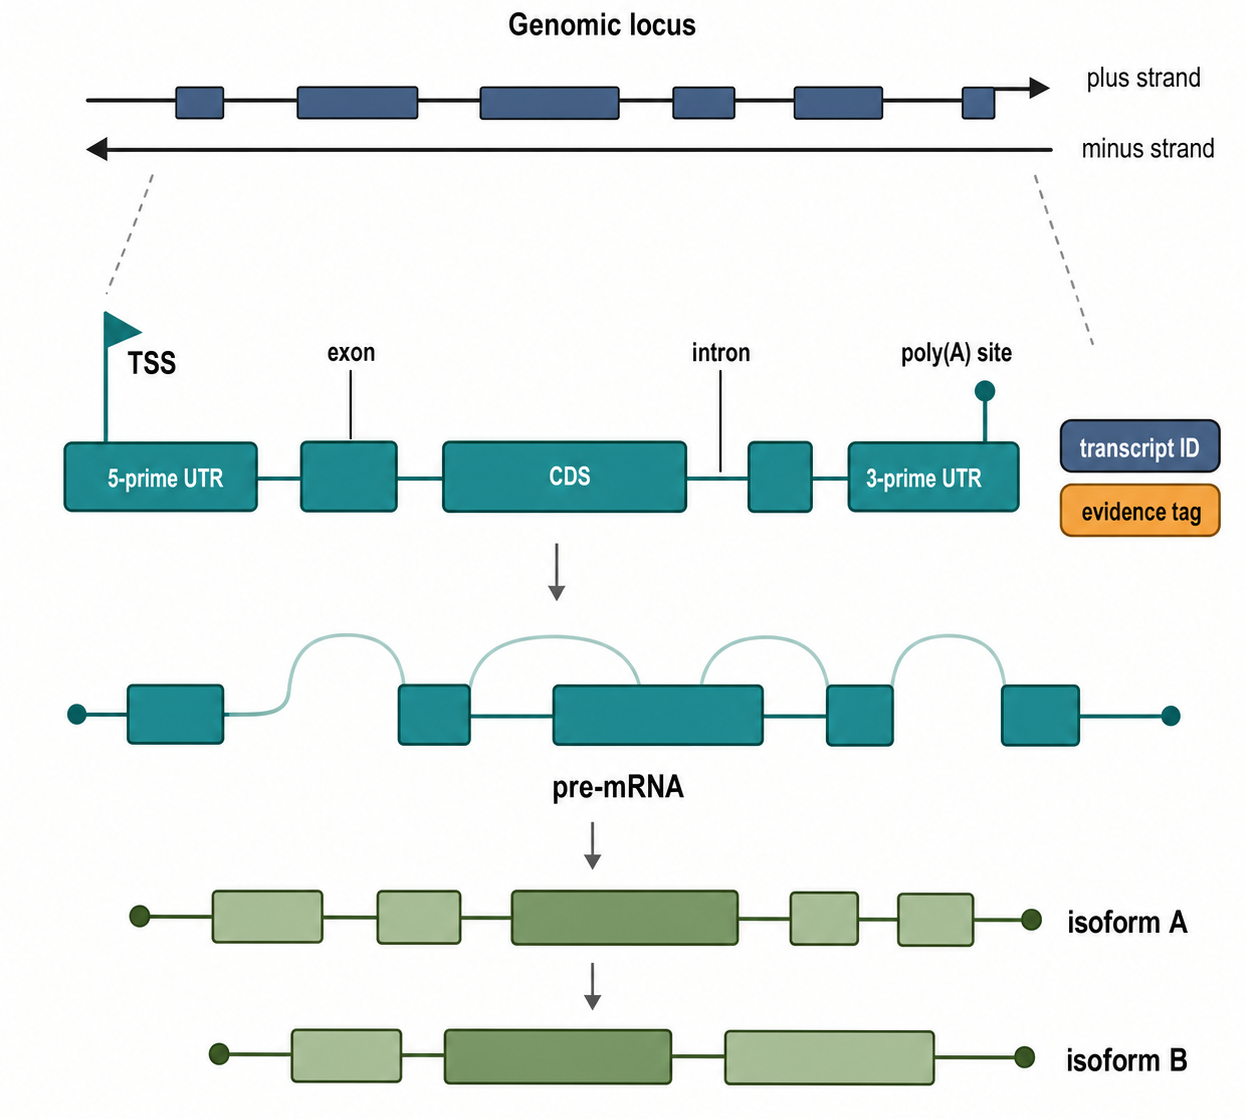
Figure 18.1. Anatomy of a Transcript Model. A transcript model is a structured annotation that represents an RNA product on a reference genome rather than the physical RNA molecule itself. This figure displays a genomic locus on both strands, identifying the transcription start site, exons, introns, coding sequence, 5′ and 3′ untranslated regions, poly(A) site, and the resulting mature transcript isoforms. Identifier fields and evidence tags on each model element illustrate how a transcript model carries curated structured metadata and should be read as an evidence-backed claim that can be revised as knowledge improves.
A transcript model begins with a reference sequence and a strand. For a plus-strand transcript, the 5′ end appears at the lower genomic coordinate and the 3′ end at the higher genomic coordinate. For a minus-strand transcript, the molecular 5′ end appears at the higher genomic coordinate. This seems elementary, but strand mistakes are common in genome-browser interpretation and file conversion. A transcript model must specify the strand because exons, UTRs, start codons, splice-site motifs, and regulatory elements are interpreted in the direction of RNA synthesis.
A transcription start site is the position where an RNA polymerase begins synthesizing RNA. In a nuclear protein-coding gene, the start site helps define the first exon and the 5′ untranslated region. The first exon can be entirely untranslated, partly coding, or part of a noncoding RNA. A promoter can have a focused start site, a cluster of nearby starts, or a broad initiation region. Some genes use alternative promoters, producing isoforms with different first exons and different regulatory sequences. Transcription initiation is therefore a source of isoform diversity, not only a feature upstream of isoform diversity.
The evidence for a transcription start site depends on the method. Cap-analysis methods enrich for capped 5′ ends and can support initiation sites for RNA polymerase II transcripts. Full-length cDNAs and some long-read protocols can support 5′ boundaries, especially when the method is designed to capture complete ends. Short-read assemblies can infer a 5′ boundary from coverage and junction patterns, but a boundary inferred from coverage is weaker because low expression, incomplete cDNA synthesis, degradation, or library bias can create an apparent end. Promoter marks and transcription-factor occupancy can support promoter activity, but they do not by themselves define the nucleotide where RNA begins.
The biological consequence of start-site choice can be substantial. Different first exons can recruit different splice patterns, and the 5′ UTR can alter translation through RNA structure, upstream open reading frames, internal ribosome entry activity, RNA-binding proteins, or sequence motifs that influence stability. A primary study showing that sites of transcription initiation drive mRNA isoform selection provides direct support for treating transcription start sites as isoform-defining features rather than decorative endpoints. Chapter 15 treats promoter and enhancer logic, while Chapter 28 treats alternative splicing mechanisms that can interact with promoter choice.
An exon is a segment retained in a processed transcript. In the simplest textbook drawing, a pre-mRNA contains exons separated by introns, the introns are removed, and the exons are ligated to form the mature mRNA. That drawing is useful, but the annotation reality is more complex. First, exons are not synonymous with coding regions. A 5′ UTR exon can be entirely untranslated. A 3′ UTR exon can be untranslated yet regulatory. A long noncoding RNA can have multiple exons and no protein-coding sequence. Second, exon inclusion can be cell-type-specific, developmental-stage-specific, stress-regulated, or disease-associated. Third, some apparent exons may be low-support artifacts, unspliced precursor fragments, or products of cryptic splicing.
An intron is a sequence removed from a precursor RNA by splicing. In nuclear pre-mRNAs, spliceosomal introns are recognized through splice sites, branch-point regions, polypyrimidine tracts in many systems, exonic and intronic regulatory elements, and the spliceosome. In transcript annotation, an intron is often inferred from the gap between two exons joined by a splice junction. A retained intron is a boundary case. It may represent a regulated isoform, a nuclear-retained RNA, a transcript targeted by nonsense-mediated decay, a partially processed precursor, or an artifact of genomic DNA contamination. A retained-intron annotation should therefore state the evidence and context, not merely list the intron as present.
The transcript end is the 3′ boundary of the model. For many eukaryotic mRNAs, the mature 3′ end is created by cleavage followed by poly(A) tail addition. Alternative polyadenylation can create isoforms with distinct 3′ UTR lengths or different terminal coding exons. A shorter 3′ UTR may remove miRNA sites or RNA-binding protein motifs. A different terminal exon may change the protein C-terminus. A distal poly(A) site may include localization elements or destabilizing elements. Chapter 29 treats the biochemical machinery of 3′ end formation; this chapter emphasizes how those ends are represented and cited.
Specialized end resources show why 3′ annotation is not static. PolyA_DB v4 integrates 3′ end and long-read sequencing evidence to support systematic poly(A) site identification and isoform annotation in human and mouse genomes. This kind of resource can reveal alternative ends that a general annotation missed, revise terminal exons, or distinguish nearby cleavage sites. However, “polyadenylation site” must be used carefully because some sources use the term for the cleavage site and others for the upstream polyadenylation signal.
UTR annotation is often treated as less important than coding sequence annotation, but that shortcut fails for RNA biology. A 5′ UTR can determine how ribosomes initiate translation. A 3′ UTR can determine stability, localization, translational regulation, and response to miRNAs or RNA-binding proteins. Two isoforms with the same protein-coding sequence can behave differently because their UTRs differ. Conversely, two isoforms with different coding sequences may have similar expression patterns if their regulatory UTRs are shared. Annotation of UTRs is therefore central to interpreting gene regulation.
Box 18.1. A Junction Is Not an Isoform
- A splice-junction read is a local observation: it shows that exon A is joined to exon B in at least some molecules in the sample.
- An isoform is a transcript-level model: it specifies which exons are present, the 5′ end, the 3′ end, strand, and usually a biotype, all belonging to a specific RNA product.
- A junction read does not show what other exons surround the junction, what 5′ or 3′ boundary the molecule has, or how abundant the full isoform is.
- Calling a junction an isoform overstates the evidence; calling a detected molecule “functional” is a separate and stronger claim that requires additional evidence.
- Each evidence type—junction, coverage, long read, protein, phenotype—supports a different claim and needs its own support statement.
A transcript model may show a 5′ boundary, a splice junction, and a 3′ boundary. Those graphical boundaries should not be overread. A 5′ boundary may reflect transcription initiation, but it may also reflect RNA processing, degradation, incomplete reverse transcription, or assembly cutoff. A 3′ boundary may reflect cleavage and polyadenylation, but it may also reflect incomplete capture or decay. A junction may reflect regulated splicing, but it may also reflect rare mis-splicing or a mapping artifact. The mechanism requires evidence matched to the claim.
18.2. Isoform definitions, transcript support levels, and annotation confidence
An isoform is a distinguishable RNA product from a gene, locus, or transcription unit. The word is common but context-dependent. A “splice isoform” differs by splice pattern. A “transcription start isoform” differs by 5′ end or first exon. A “polyadenylation isoform” differs by 3′ end. A “coding isoform” differs in protein-coding sequence. A “UTR isoform” may encode the same protein but differ in untranslated sequence. For small RNAs, a precursor, a mature guide or regulatory RNA, and an isomiR-like processing variant can all require separate annotation logic.
The first evidence level is local feature evidence. A splice-junction read crossing an exon-exon boundary supports that a splice junction exists in the library. It does not prove the complete chain of exons in the molecule. A read pileup over an exon supports expression of sequence overlapping the exon, but it may not distinguish an mRNA isoform from a retained intron, overlapping antisense transcript, unprocessed RNA, or paralogous mapping. Paired-end reads can connect nearby regions, but typical short fragments do not span long transcripts.
The second evidence level is transcript-structure evidence. Full-length cDNA sequencing, long-read cDNA sequencing, and direct RNA sequencing can connect distant exons, alternative starts, and alternative ends on single molecules. This is why long-read RNA sequencing is transformative for isoform discovery and disease transcriptomics, while benchmarked long-read transcriptome assembly methods illustrate that molecule-level evidence still requires algorithmic and sampling controls. Yet long-read evidence must be interpreted with its own artifacts. Reverse transcription can stop early. PCR can bias molecules. Sequencing errors can create false splice-site support if aligners are permissive. Highly similar paralogs can confuse mapping. Low-depth long-read data may miss abundant short isoforms or rare cell-type-specific molecules.
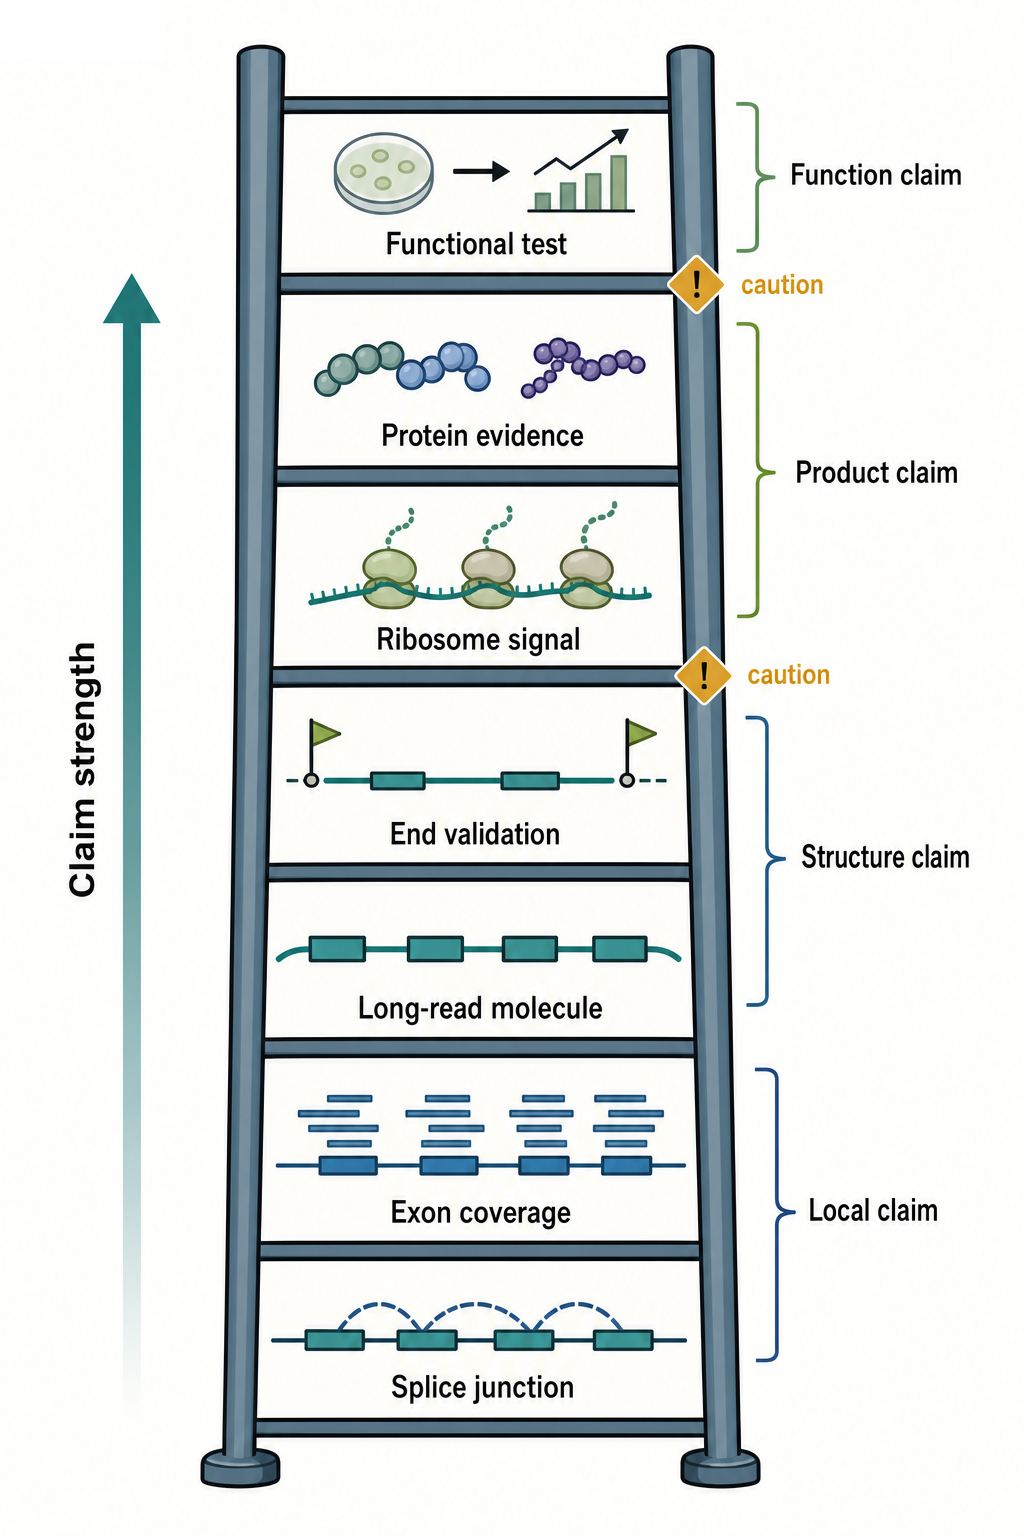
Figure 18.2. Isoform Evidence Ladder. Different types of experimental evidence support transcript claims with different strength and scope. This figure arranges evidence in a ladder from local observations—splice-junction reads and exon coverage—upward through full-molecule structure obtained by long-read RNA-seq, boundary validation by cap analysis and 3′ end sequencing, and finally translation or functional perturbation evidence, making clear that each rung answers a distinct biological question and that no single evidence type simultaneously validates the full transcript model, its abundance, and its function.
The third evidence level is boundary-specific evidence. Cap-enriched methods help validate 5′ ends. 3′ end sequencing and poly(A)-site mapping help validate cleavage and polyadenylation sites. A long read that lacks independent end validation may still be truncated, especially at the 5′ end. A transcript model with strong internal splice support but weak end support should be described as having good internal structure evidence and incomplete boundary evidence.
The fourth evidence level is product and function evidence. Ribosome profiling can support translation of a region, but ribosome occupancy can arise from upstream open reading frames, noncanonical translation, scanning, stalling, or noise. Proteomics can support peptides, but many peptides are shared among isoforms. Isoform-specific protein evidence is strongest when a peptide uniquely spans an isoform-specific junction or sequence. Functional evidence is strongest when an isoform-specific perturbation changes a phenotype and a rescue experiment restores it.
Transcript support level is a curation concept for describing how much evidence supports a transcript model. The exact label system varies by database, but the principle is general: not all transcript models carry the same confidence. Some are manually curated and supported by full-length evidence. Some are computationally predicted. Some are retained because they are useful but have weak boundary support. Some are flagged for nonsense-mediated decay, retained intron, low confidence, or problematic sequence. Current GENCODE and Ensembl release papers document resource-level annotation practices, while MANE and APPRIS show two different but complementary conventions for choosing representative transcripts: matched clinical/research transcript sets and functionally important isoforms.
Annotation confidence is multidimensional. A transcript can be confidently detected but poorly quantified. A splice pattern can be confidently supported while the 5′ end remains uncertain. A protein-coding sequence can be plausible while the 3′ UTR is incomplete. A transcript can be abundant in one tissue and absent in another. A disease association can be statistically strong while the causal isoform remains unknown. Good writing separates these claims instead of compressing them into “the isoform exists” or “the isoform is functional.”
Long-read single-cell and disease datasets illustrate both the power and the caution. An isoform-resolution transcriptomic atlas of colorectal cancer from long-read single-cell sequencing connected transcript structures to cell states and disease contexts. This kind of result can reveal isoform patterns invisible to short-read gene-level analysis. It does not by itself show that an isoform causes a cancer phenotype. Causal interpretation requires perturbation, mechanism, and controls for cell composition, expression level, and annotation bias.
Tissue-specific examples show why functional isoforms should not be dismissed. A study of cochlear transcript diversity implicated an otoferlin short isoform in auditory function, illustrating how isoform-resolved transcript evidence can connect to a tissue-specific biological role. The lesson is not that every short isoform is functional. The lesson is that function requires a chain of evidence: transcript structure, expression context, molecular consequence, and phenotype.
Table 18.1. Transcript Model Fields and Evidence. Core fields of a transcript model, what each represents, the typical evidence used to determine it, common sources of uncertainty, and the related conceptual term.
| Field | What it represents | Typical evidence | Common uncertainty | Related concept |
|---|---|---|---|---|
| Chromosome / scaffold | Reference sequence carrying the transcript | Genome assembly sequence | Scaffold may be unplaced or alternate haplotype | Genome assembly |
| Strand | Direction of RNA synthesis | Strand-specific RNA-seq; cDNA orientation | Antisense mapping can mislabel strand | Coordinate system |
| Exon | Retained segment in processed transcript | Splice-junction reads; exon coverage | Low-expression exons may be missed or merged | Exon; UTR; CDS |
| Intron | Removed segment between exons | Splice-junction reads spanning the gap | Retained intron may be a functional isoform | Intron; retained intron |
| TSS | Position where RNA synthesis begins | Cap analysis; full-length cDNA | Coverage-based ends may reflect degradation or truncation | Transcription start site |
| Transcript end | 3′ boundary of the model | 3′ end sequencing; poly(A) mapping | Incomplete capture or decay can truncate the end | Transcript end; polyadenylation site |
| UTR | Transcribed region outside coding sequence | RNA-seq coverage; cDNA sequencing | Often annotated less precisely than CDS | Untranslated region |
| CDS | Translated portion of protein-coding transcript | Proteomics; ribosome profiling; conservation | ORF prediction may miss short or novel ORFs | Coding sequence |
| Biotype | Functional or structural classification | Database curation; computational inference | Reclassification is common across annotation releases | Biotype |
| Transcript ID | Database identifier for this model | Assigned at annotation time | IDs may change at release or assembly update | Versioned accession |
| Gene ID | Identifier for the parent locus | Assigned at annotation time | Gene IDs differ across databases; symbols can collide | Gene model |
| Support level | Evidence grade for the model | Curated or computed from breadth of evidence | Grading criteria and labels differ by database | Transcript support level |
| Release | Annotation distribution version | Database release notes | Same locus can have different models across releases | Annotation release |
Box 18.2. UTR Changes Can Be Functional Without Protein Changes
- Two mRNA isoforms can share an identical coding sequence yet differ in their untranslated regions.
- A longer 3′ UTR may include miRNA recognition elements or RNA-binding protein binding sites that reduce stability or inhibit translation.
- A shorter 3′ UTR produced by proximal polyadenylation may escape those regulatory sites, resulting in higher protein output from the same coding sequence.
- A 5′ UTR can contain upstream open reading frames or RNA secondary structures that alter ribosome access to the main start codon.
- Reporting only coding sequence identity between two isoforms while ignoring their UTR differences can lead to an incorrect conclusion that the isoforms are biologically equivalent.
A splice junction is a local observation: exon A is joined to exon B in at least some molecules in the sample. An isoform is a transcript-level model: exon A, exon B, other exons, the 5′ end, the 3′ end, strand, and usually a biotype belong together in a specific RNA product. Calling a junction an isoform overstates the evidence. Calling a full-length molecule “functional” can also overstate the evidence. Each claim needs its own support level.
Table 18.2. Isoform Evidence Types. Evidence types used to support isoform claims, ranked from local to functional, showing what each type supports and does not prove.
| Evidence type | Supports | Does not prove | Main artifact | Stronger follow-up evidence |
|---|---|---|---|---|
| Short-read splice junctions | Existence of a local exon-exon join | Full isoform structure across all exons | Multi-mapping reads at paralogs or repeats | Long-read molecule connecting all exons |
| Exon coverage | Transcription of a sequence region | Which isoform the coverage belongs to | Overlapping antisense or paralogous mapping | Isoform-specific junction or long-read support |
| Full-length cDNA | Complete molecule structure from 5′ to 3′ | Biological abundance or regulation | PCR amplification bias; chimeric clones | Independent cDNA validation across multiple samples |
| Long-read RNA-seq | Molecule-level exon connectivity | Absence of truncation or sequencing error | Reverse-transcription stops; alignment error at repeats | End-specific assays to validate 5′ and 3′ boundaries |
| Cap analysis | Transcription initiation position | All TSS positions for a promoter | Cap-trapping efficiency and protocol bias | Complementary full-length cDNA or CAGE support |
| 3′ end sequencing | Cleavage and polyadenylation site | Regulated versus constitutive poly(A) usage | Internal priming on A-rich internal sequences | Orthogonal poly(A)-site mapping method |
| Ribosome profiling | Ribosome occupancy over a region | Production of a stable full-length protein | Upstream ORF scanning or stalling footprints | Mass spectrometry for peptide-level protein evidence |
| Proteomics | Peptide existence in a sample | All isoforms encoding that peptide | Shared peptides prevent isoform discrimination | Isoform-specific junction peptide identification |
| Perturbation | Functional relevance of a sequence element | Mechanism or causal isoform identity | Off-target effects of the perturbation reagent | Rescue experiment with isoform-specific construct |
| Clinical association | Statistical link between isoform and phenotype | Causal role or molecular mechanism | Confounding by cell composition or expression level | Mechanistic or experimental functional follow-up |
18.3. GENCODE, RefSeq, Ensembl, UCSC, organism databases, and browser tracks
Transcript annotation resources share a goal but differ in scope. GENCODE is a major human and mouse gene-annotation resource that emphasizes high-quality gene and transcript models. Ensembl provides genome annotation, comparative genomics, variation, regulation, and cross-species resources. RefSeq provides curated and computational reference sequence records with accessioned sequences and versioning. UCSC Genome Browser provides genome assembly browsing, track integration, data hubs, and access to many annotation and experimental layers. Organism-specific databases add community curation, genetic nomenclature, phenotype links, and species-specific conventions.
Table 18.3. Annotation Resources and Browser Systems. Major transcript annotation resources and browser systems, showing scope, identifier style, best use, and main caveat.
| Resource | Main scope | Identifier style | Best use | Main caveat |
|---|---|---|---|---|
| GENCODE | Human and mouse gene and transcript annotation | ENSG / ENST with version suffix | High-quality human gene-model reference | Release-specific; conservative curation may exclude low-support transcripts |
| RefSeq | Curated and computational reference sequences across all sequenced organisms | NM, NR, NP_ with version suffix | Versioned accession-anchored reproducible citation | Different evidence threshold than GENCODE; NM vs XM status distinction |
| Ensembl | Genome annotation, variation, regulation, and comparative genomics across species | ENSG / ENST per genome | Multi-species and variation integration | Assembly and release needed; shares IDs with GENCODE but can diverge |
| UCSC Genome Browser | Assembly-based track viewer with curated annotation and data layers | Assembly name plus track names | Visual exploration; track hub integration | Screenshot alone is not reproducible provenance |
| FlyBase | Drosophila gene annotation, nomenclature, phenotypes, and literature | FBgn / FBtr identifiers | Drosophila-specific isoform and mutant context | Species-specific naming conventions differ from vertebrate resources |
| WormBase | C. elegans and nematode gene annotation and phenotypes | WBGene plus transcript name | Nematode-specific transcriptomics and genetics | Organism-specific conventions differ from vertebrate resources |
| TAIR | Arabidopsis thaliana genome and gene annotation | AT#G##### locus identifiers | Plant gene and transcript reference | Organellar and plant-specific splice contexts require attention |
| SGD | Saccharomyces cerevisiae gene annotation and phenotypes | YGL### systematic names | Yeast gene function and transcript reference | Compact genome with few introns; different assumptions from mammalian systems |
| PomBase | Schizosaccharomyces pombe gene annotation and phenotypes | SPBC#### identifiers | Fission yeast transcript and function reference | Limited isoform diversity compared to mammals |
| PolyA_DB | Human and mouse poly(A) site and 3′ end annotation | Site-centered genomic coordinates | Revising transcript ends and alternative polyadenylation analysis | Evidence coverage varies across tissues and species |
| ITAS | Integrated small-RNA transcript annotation | Locus and mature product identifiers | Distinguishing small-RNA precursors, mature forms, and processing products | Small-RNA-class-specific conventions differ from mRNA annotation |
These resources can disagree for good reasons. One resource may include more predicted transcripts, another may be more conservative. One may prioritize a curated reference transcript, another may include every supported alternative model. One may have updated to a new assembly, while another maintains an older assembly for continuity. One may use a transcript ID that maps cleanly to another resource, while another transcript is split, merged, or absent. Database disagreement should trigger provenance checking, not automatic dismissal.
GENCODE, RefSeq, and Ensembl are often used as annotation sources in RNA-seq pipelines. A gene-level quantification can change when the annotation adds an exon, splits a locus, or reclassifies a transcript. Transcript-level quantification is even more sensitive because ambiguous reads are assigned among isoforms according to a model and statistical assumptions. A pipeline using a GENCODE release, a pipeline using RefSeq, and a pipeline using Ensembl can produce different transcript lists from the same alignments. The difference is not necessarily a software error; it may reflect different annotation universes. Current GENCODE, Ensembl, and RefSeq update papers provide the database-level provenance, while MANE and APPRIS provide more specific anchors for cross-resource transcript matching, clinical transcript choice, and principal-isoform selection.
The UCSC Genome Browser is a clear example of track-based reasoning. A browser display is anchored to a genome assembly. Tracks then overlay data on that assembly. A curated gene track might show exons and coding sequence. A short-read RNA-seq track might show coverage. A junction track might show splicing evidence. A long-read track might show individual read alignments. A poly(A)-site track might show mapped 3′ ends. Conservation tracks, variant tracks, repeat tracks, and regulatory tracks add other evidence layers. UCSC Genome Browser update papers document this model of assembly-based visualization and integrated tracks.
Browser displays are excellent for exploration and teaching, but a browser screenshot is weak scientific provenance. A screenshot can omit the assembly, track version, filtering, display settings, database date, sample source, and source file. It can also visually align tracks that came from different studies, processing pipelines, and evidence standards. A reproducible claim should cite the underlying track or file, the assembly, the database release, and the coordinates. A browser session link can help readers inspect the view, but it should not replace the versioned data citation.
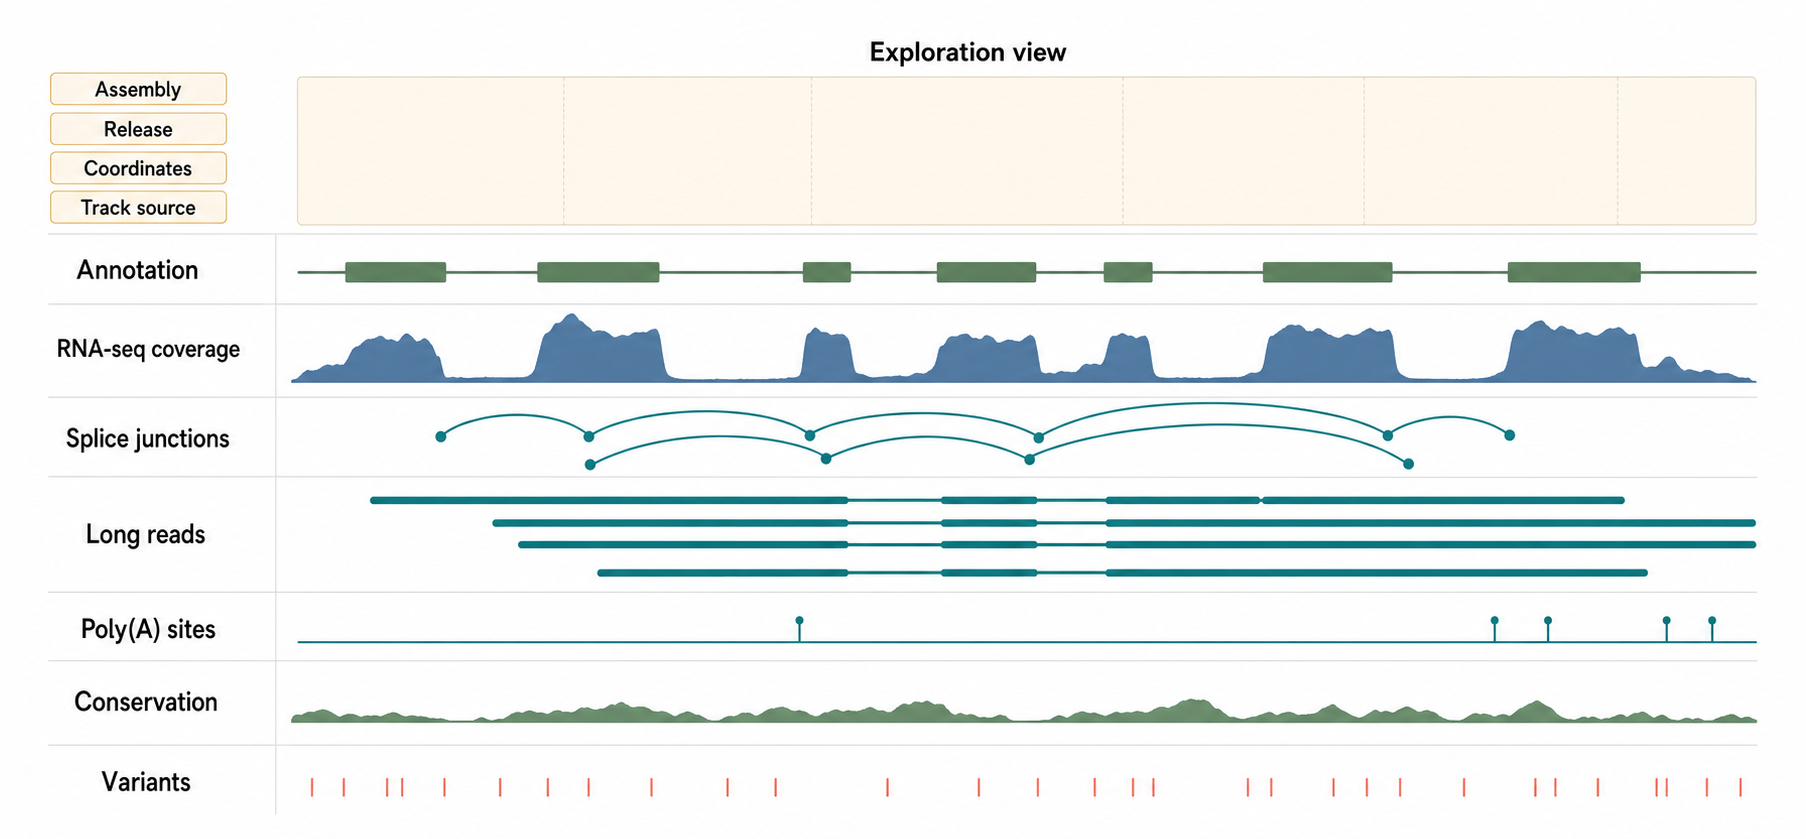
Figure 18.3. Reading a Genome Browser Track Stack. A genome browser display assembles multiple independent evidence tracks over a single reference assembly, and each track carries its own source, version, and evidence type. This synthetic browser-like view shows a curated gene annotation track, short-read RNA-seq coverage and splice-junction signals, long-read alignments, a poly(A)-site track, conservation scores, and variant calls, with assembly name and release metadata shown alongside each track, illustrating that the browser is an exploration tool rather than a unified authoritative truth layer.
Organism databases are essential because RNA annotation is not only a generic computational task. FlyBase, WormBase, TAIR, SGD, PomBase, MGI, and other community resources encode species-specific gene symbols, transcript conventions, mutant alleles, phenotypes, literature, orthology, and curated molecular biology. A transcript model for a plant gene may require plant-specific organellar and splice-variant context. A yeast transcript may be connected to a precise mutant phenotype and community-standard name. A Drosophila transcript may have nomenclature and isoform labels that are not obvious from a generic genome browser. Representative update papers for FlyBase, WormBase, TAIR, SGD, and PomBase show why community resource provenance is part of transcript interpretation, especially when nomenclature, historical gene models, mutant phenotypes, and species-specific transcript conventions are involved.
Specialized RNA resources complement general annotations. PolyA_DB focuses on poly(A) sites and 3′ end evidence. ITAS addresses integrated transcript annotation for small RNAs, where precursor transcripts, mature small RNAs, processing products, and genomic loci must be distinguished. lncRNA, circRNA, miRNA, snoRNA, tRNA, and Rfam-like resources have their own boundary conventions and evidence standards, discussed further in Chapter 19 and class-specific chapters.
Box 18.3. Browser Screenshots Are Not Provenance
- A genome-browser screenshot can omit the assembly version, track source, track date, processing settings, display scale, and sample identity.
- Multiple tracks in one screenshot may originate from different studies, processing pipelines, and evidence standards, making combined visual comparison misleading.
- Reproducible citation of a browser observation requires: genome assembly name and version, track name and source database, track release or download date, genomic coordinates and strand, display settings if they affect interpretation, and a link to the underlying data file.
- A shareable browser session link is a useful supplement for readers but is not a substitute for the versioned data citation.
- When a figure panel shows a browser view, the legend must state the assembly, tracks, and source so the view can be reconstructed independently.
A genome browser does not show “the transcriptome” as a single object. It shows selected tracks. A curated annotation track answers “what model does this resource currently distribute?” A coverage track answers “where did reads accumulate under these processing choices?” A conservation track answers “which bases are conserved under this alignment?” A variant track answers “which variants were recorded in this dataset?” A user track answers “what did this user upload?” Treating these as one undifferentiated truth layer is a common source of false confidence.
18.4. File formats, coordinate systems, identifiers, and versioning
Table 18.4. File Formats and Coordinate Conventions. Common file formats used in transcript and genome annotation, with coordinate conventions, strand handling, RNA uses, and typical errors.
| Format | Common contents | Coordinate convention | Strand handling | RNA-specific use | Common error |
|---|---|---|---|---|---|
| GTF | Genes, transcripts, exons, CDS, attributes | 1-based closed | Strand column (+/-/.) | Transcript quantification input; splice-site annotation | Missing or malformed attribute fields; feature hierarchy inconsistencies |
| GFF3 | Genes, transcripts, features with parent-child relationships | 1-based closed | Strand column | Alternative to GTF with explicit parent-child hierarchy | Attribute parsing differences from GTF; ID vs Name field conflicts |
| BED | Genomic intervals with optional block structure | 0-based half-open | Optional strand column | Browser tracks; exon blocks; peak calls | Pasting BED coordinates into 1-based tools without conversion |
| bigBed | Indexed binary BED for large interval tracks | 0-based half-open | Inherits from BED specification | Large transcript or peak tracks for genome browsers | Incorrect block fields when converting exon structure from GTF |
| bigWig | Indexed continuous signal over genome | 0-based half-open | Single-strand signal typical | RNA-seq coverage tracks; conservation scores | Strand confusion when overlaying sense and antisense signals |
| BAM | Aligned reads with CIGAR strings | 0-based | Bitflag encodes read strand | Splice-aware read alignment; isoform evidence inspection | CIGAR N operator for spliced introns versus D for deletions |
| CRAM | Compressed reference-based aligned reads | 0-based | Bitflag encodes read strand | Space-efficient storage of large RNA-seq datasets | Reference sequence mismatch causes decoding failure |
| FASTA | Reference or transcript sequences | Not an interval format | Sequence written in synthesis direction | Transcript sequence retrieval; alignment index building | Strand confusion when extracting minus-strand transcript sequences |
| FASTQ | Sequencing reads with quality scores | Not a genomic interval format | Read orientation depends on library protocol | Raw RNA-seq data input to alignment pipelines | Mismatched read-pair orientation flags in strandedness-aware tools |
| VCF | Genetic variants with genotypes and annotations | 1-based | REF/ALT alleles on forward strand | Variant-to-transcript consequence annotation | Coordinate convention mismatch when intersecting with BED interval files |
Transcript models are distributed through files as well as web interfaces. A GTF file is a tabular annotation format commonly used for genes, transcripts, exons, coding sequences, start codons, stop codons, and attributes such as gene ID, transcript ID, gene name, transcript name, and biotype. A GFF3 file is a related feature format with explicit parent-child feature relationships. GTF and GFF3 are similar enough to invite casual conversion but different enough to create errors if attributes and feature hierarchies are not handled carefully.
BED files represent genomic intervals and are widely used for browser tracks and interval operations. BED conventions commonly use 0-based, half-open intervals. bigBed is an indexed binary form useful for large interval tracks. bigWig stores indexed continuous signal such as coverage or conservation. BAM and CRAM store aligned reads, with CIGAR strings that encode matches, insertions, deletions, splicing, clipping, and other alignment operations. FASTA stores sequences, and FASTQ stores sequencing reads and quality scores. VCF stores variants. Each file type answers a different question and carries different assumptions.
The most important coordinate distinction for many RNA users is 0-based half-open versus 1-based closed intervals. In a 1-based closed interval, the first base of a chromosome is position 1, and both the start and end positions are included. In a 0-based half-open interval, the first base is position 0, the start is included, and the end is excluded. The same physical interval can therefore have different numeric coordinates in different formats. If a BED interval is pasted into a GTF field without conversion, the model can shift by one nucleotide.
One-nucleotide errors are biologically meaningful. A splice donor and splice acceptor are sequence-specific. A shift can move the annotated splice site away from the canonical dinucleotide or an experimentally supported noncanonical site. A start codon or stop codon can be lost or gained. An RNA editing site can be assigned to the wrong base. A variant can be placed in an exon rather than an intron. A guide RNA, antisense oligonucleotide, PCR primer, or CRISPR edit can target the wrong sequence. Coordinate hygiene is therefore not clerical; it protects biological interpretation.
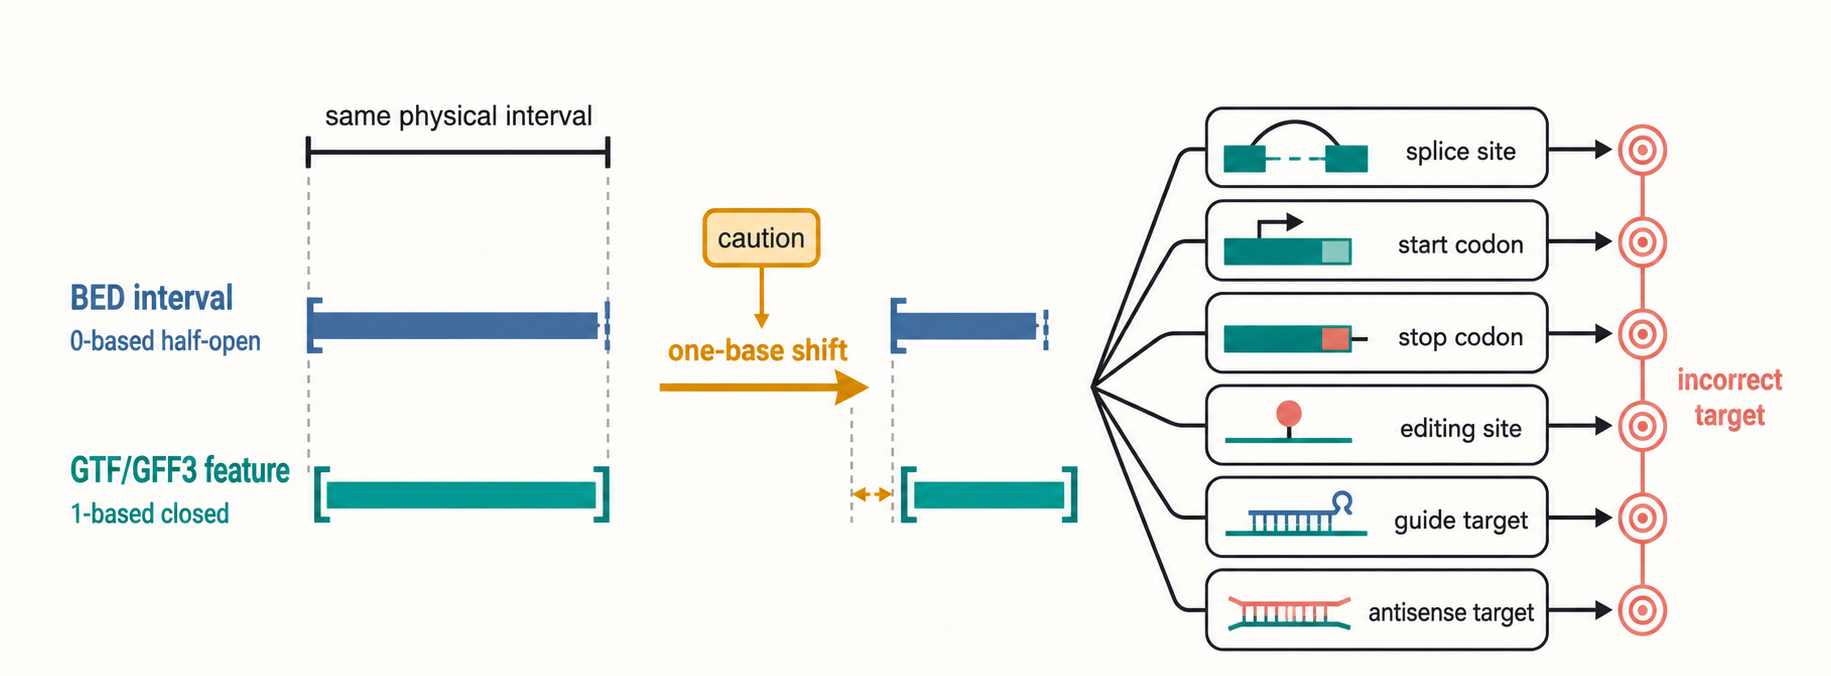
Figure 18.4. Coordinate System Failure Modes. Mixing coordinate conventions between file formats can shift an annotated feature by one nucleotide with biologically meaningful consequences. The figure shows the same genomic interval encoded in BED-style 0-based half-open coordinates and in GTF/GFF3-style 1-based closed coordinates, then traces how a one-base offset can displace a canonical splice donor or acceptor, move a start or stop codon, misassign an RNA editing site, and misdirect a guide RNA or antisense oligonucleotide to an incorrect target sequence.
Identifiers have scopes. A gene symbol such as a short human-readable name is convenient in prose, but gene symbols can change, have aliases, collide across species, or refer to a gene family rather than a unique record. A database gene ID is more stable but belongs to a database namespace. A transcript ID identifies a transcript model in a database. A transcript accession with a version suffix identifies a specific sequence or annotation version. A coordinate identifies a locus only relative to an assembly and sequence naming convention.
Version suffixes should not be removed casually. In many systems, an accession without a suffix may point to the current version, while the suffix points to the exact sequence version used in an analysis. If a transcript sequence changes by even one base, downstream consequences can include altered coding sequence, altered UTR motifs, altered primer binding, altered peptide mapping, altered variant interpretation, and altered read assignment. Removing the suffix may make a table look cleaner while making the analysis less reproducible.
Annotation releases also need to be recorded. A statement such as “GENCODE protein-coding transcripts” is incomplete without a release number and assembly. A statement such as “RefSeq NM transcripts” is incomplete without the date or release context if the analysis is sensitive to transcript definitions. A statement such as “UCSC knownGene” or a named browser track is incomplete without the assembly and track version or date. RNA-seq metadata-standardization work reinforces the broader point that reproducibility depends on explicit metadata rather than implicit defaults.
Versioning also applies to software and filters. A transcriptome index built from one annotation release and one aligner version may not match a quantification generated with another release and another parser. Biotype filters can remove retained-intron transcripts, nonsense-mediated decay transcripts, pseudogenes, immunoglobulin segments, or unplaced scaffolds. A default filter in one workflow can be absent in another. If the scientific claim depends on a transcript list, the filter is part of the claim.
Box 18.4. Coordinate Systems Create Off-by-One RNA Errors
- BED files use 0-based, half-open intervals: position 0 is the first base, and the end position is excluded from the feature.
- GTF and GFF3 files use 1-based, closed intervals: position 1 is the first base, and both start and end positions are included in the feature.
- The same physical genomic interval has different start and end numbers in these two conventions.
- Copying a BED start coordinate directly into a GTF field, or vice versa, shifts the annotated feature by one nucleotide.
- A one-base shift can move a splice donor or acceptor away from the canonical dinucleotide, displace a start or stop codon, misassign an RNA editing site, or misdirect a guide RNA or antisense oligonucleotide to an unintended sequence.
- Coordinate hygiene protects biological interpretation: always check which convention a tool or file expects before converting or combining interval data.
For transcript-sensitive work, record the assembly, database, annotation release, source file, checksum if available, gene ID, transcript ID, transcript version, biotype, coordinates, coordinate convention, strand, filters, software, and date accessed. For browser claims, record track names, track sources, track versions, display settings when relevant, and the session link as a convenience rather than as the only citation.
18.5. Model drift, obsolete annotations, and reproducible citation of transcript models
Table 18.5. Reproducible Transcript Citation Checklist. Items that must be recorded to make a transcript-sensitive analysis reproducible, with rationale, example, and the failure mode when each is omitted.
| Required item | Why it matters | Example value | Failure mode if omitted |
|---|---|---|---|
| Genome assembly | Coordinates are meaningless without the assembly | GRCh38 / hg38 | Results cannot be mapped to the correct genomic position |
| Database | Annotation universes differ across sources | GENCODE | Reader cannot identify which transcript models were used |
| Annotation release | Transcript models drift across releases | GENCODE v46 | Analysis cannot be reproduced with the same model set |
| Transcript ID | Identifies a specific transcript model | ENST00000456328 | Ambiguity about which isoform was analyzed |
| Transcript version suffix | Identifies the specific sequence version | ENST00000456328.2 | Undetected change to sequence or model across releases |
| Gene ID | Links transcript to its locus | ENSG00000223972 | Unclear which locus was studied when gene symbols collide |
| Coordinate convention | Prevents off-by-one errors in feature definition | 0-based half-open (BED) | One-nucleotide shift can misplace splice sites or codons |
| Source file | Enables verification and exact download | gencode.v46.annotation.gtf.gz | Reader cannot obtain the exact annotation file used |
| File checksum | Confirms file identity and integrity | MD5: a3f9. | File may be silently replaced or corrupted on server |
| Biotype filters | Defines which transcript classes were included | protein_coding only | Retained-intron or NMD transcripts may be included or excluded unexpectedly |
| Software and version | Determines parsing and assignment logic | STAR 2.7.11a | Different software can produce different quantifications from the same annotation |
| Date accessed | Anchors web resource retrieval in time | 2025-03-12 | Database may have been updated since the analysis was performed |
| Browser track names | Identifies evidence layers in browser-based figures | GENCODE v46 Genes track | Readers cannot reconstruct the display or inspect the underlying data |
Model drift is change in annotation across time. Transcript models drift because evidence improves, assays become more sensitive, tissues and conditions are sampled more broadly, long-read sequencing connects exons that were previously ambiguous, 3′ end data revise transcript ends, cap data revise start sites, proteomics changes coding interpretation, and genome assemblies change. A database that never changes would preserve reproducibility but fail to incorporate new knowledge.
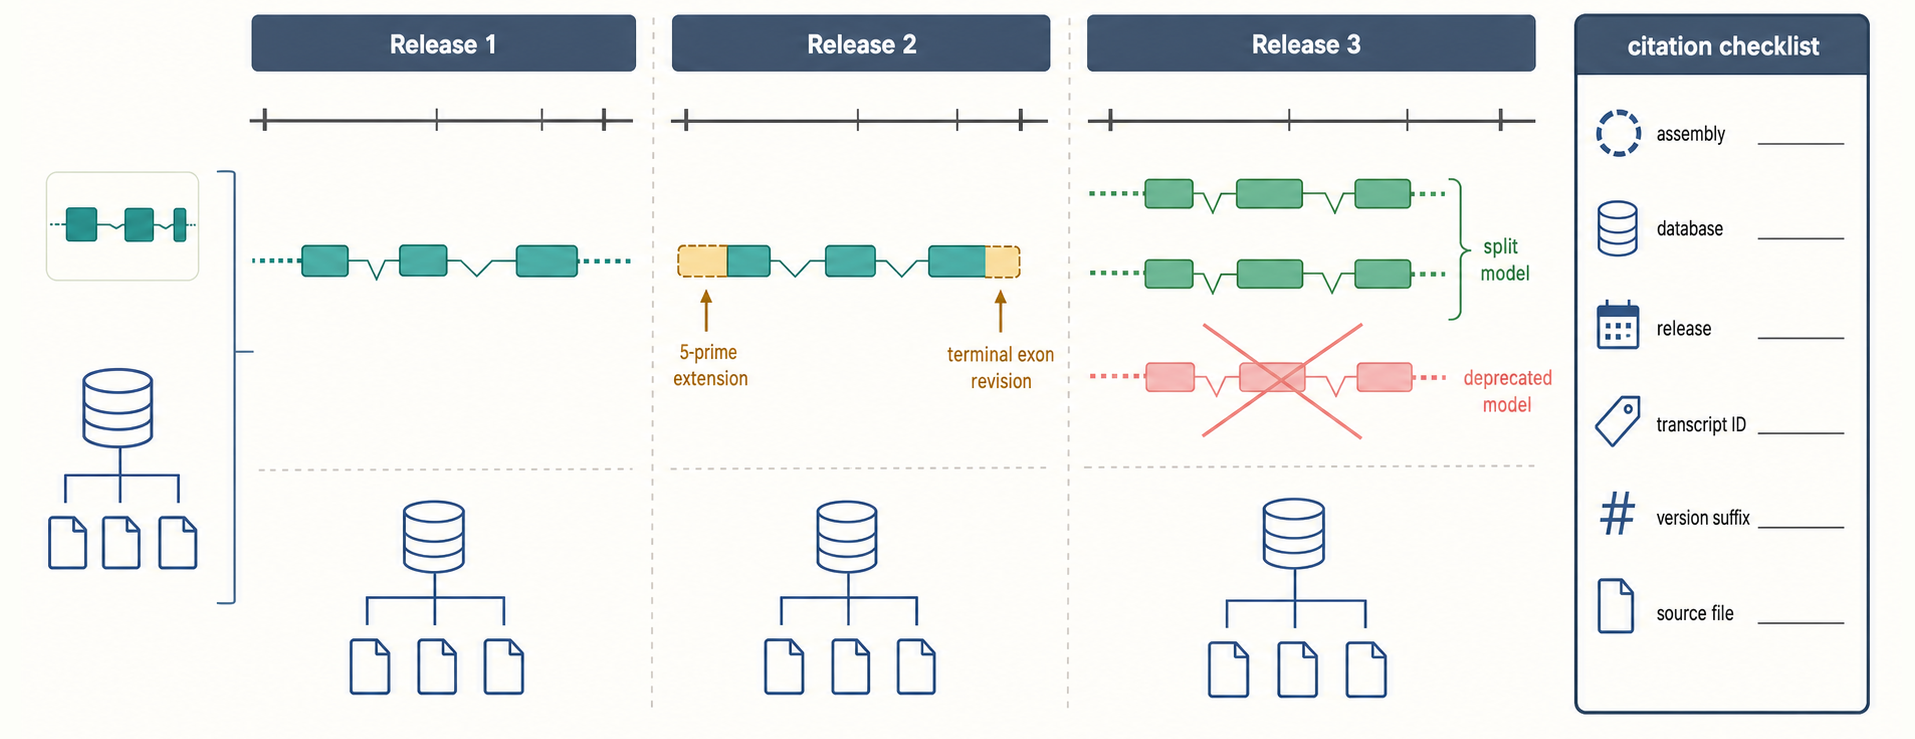
Figure 18.5. Annotation Drift Across Releases. Transcript models at a single locus can change substantially across annotation database releases as RNA evidence improves. The figure traces one locus through three consecutive releases, showing a 5′ boundary extension after cap evidence appears, a terminal exon revision after poly(A)-site data become available, and a split or deprecation in a later release, accompanied by a reproducible citation checklist that records the assembly, database, release, identifier, and version suffix required to reconstruct any one of the historical models.
Drift can take many forms. A transcript can be extended at the 5′ end after cap evidence appears. It can be shortened after a suspected first exon is judged unsupported. A terminal exon can be replaced when poly(A)-site evidence improves. Two transcripts can be merged when long reads connect their exons. One transcript can be split when evidence shows two independent products. A protein-coding transcript can become noncoding if the open reading frame is unsupported. A transcript can be marked as nonsense-mediated decay, retained intron, readthrough, pseudogene-derived, or low support. A model can be retired while its accession remains in archives for reproducibility.
Obsolete does not always mean scientifically useless. If a 2018 RNA-seq paper quantified transcripts against a 2018 annotation release, reproducing the paper may require that exact release even if current annotations are better. If an oligonucleotide was designed against an older transcript sequence, the old model is relevant for understanding the design. If a clinical report cites an older accession, the version must be interpreted in historical context. The error is not using an old model; the error is hiding which model was used.
Specialized resources can accelerate drift by adding resolution. PolyA_DB v4 can revise poly(A)-site usage and terminal transcript models. ITAS and related small-RNA annotation strategies can separate precursor transcripts, mature small RNAs, and processing products. Isoform-level m6A profiling in human brain and isoform-specific RNA structure approaches such as Nano-DMS-MaP illustrate that downstream molecular assays depend on accurate transcript models. If a signal is assigned to the wrong isoform, the biological interpretation can be wrong even when the assay itself worked.
Model drift is especially consequential in disease and therapeutic contexts. A variant can be exonic in one isoform and intronic in another. A splice-switching oligonucleotide can target an exon present only in selected transcripts. A small interfering RNA or antisense oligonucleotide can hit some isoforms and miss others. A guide RNA can target a sequence that differs across transcript or genome versions. A biomarker assay can appear discordant if the measured isoform changed annotation between studies. Long-read RNA sequencing in disease contexts shows why isoform resolution matters, but clinical claims need additional validation beyond discovery.
Reproducible transcript citation is a habit of scientific precision. Instead of writing “the TP53 transcript” or “the long isoform,” a methods section should cite the database, assembly, release, transcript ID, version suffix where available, and any filters. Instead of writing “as shown in UCSC,” a figure legend should state the assembly, track names, track sources, coordinates, and date or release. Instead of writing “RefSeq annotation,” a pipeline should state which RefSeq files, download date or release, and accession versions were used. RefSeq curation and reference-sequence standards provide one anchor for this kind of accession-aware thinking.
Model drift also creates an educational challenge. Students and researchers often learn a gene through one familiar diagram. That diagram can become mentally fixed even after annotations change. A mature reader should treat transcript diagrams as release-specific claims. The right question is not “what is the transcript?” but “which transcript model, in which resource, on which assembly, with which evidence, under which biological context?”
Box 18.5. Obsolete Does Not Mean Useless
- A transcript model that has been retired, replaced, merged, or superseded is obsolete with respect to current biology but may remain essential for reproducing a previous analysis.
- If a 2018 RNA-seq study quantified transcripts against a 2018 annotation release, reproducing that study requires the historical release, even if current annotations are better.
- If an oligonucleotide was designed against an older transcript sequence, the historical model is necessary to understand the design and its limitations.
- If a clinical report cites an older accession, the version must be interpreted in the context of that historical annotation.
- Archive older model files, cite them with version and release information, and note explicitly when current annotations differ from the historical models used in prior work.
A retired transcript model can be wrong for current biological interpretation yet correct for reproducing a previous analysis. Archive older models, cite them precisely, and explain when current annotations differ. Current annotations are usually preferred for new analyses, but versioned historical annotations are part of the scientific record.
Experimental Foundations and Evidence
Transcript annotation is built by combining many evidence types. No single evidence type answers all transcript-model questions.
Short-read RNA-seq provides high-throughput expression and splice-junction evidence. Its strengths are depth, quantitative dynamic range, many samples, and compatibility with differential expression and splicing analysis. Its limitations are fragment length, ambiguous assignment among similar isoforms, mapping uncertainty in repeats and paralogs, strand ambiguity in some protocols, and dependence on computational model assumptions. Short reads are strong for local evidence but weak for reconstructing complete isoforms when alternative exons are far apart.
Long-read RNA sequencing provides molecule-level connectivity. A long read can join a first exon, internal exons, a retained intron, an alternative last exon, and a poly(A) tail in one molecule. This makes long reads powerful for discovering transcript structures that short reads cannot resolve. The method still requires controls. Truncated cDNAs can masquerade as short isoforms. Sequencing errors can affect splice-site recognition. Reverse transcription can introduce artifacts. Direct RNA sequencing avoids cDNA synthesis but has its own throughput, accuracy, and modification-related interpretation limits.
End-mapping assays strengthen boundary evidence. Cap-oriented assays such as CAGE support transcription start sites and help distinguish initiation from internal fragments; high-resolution promoter-profiling integrations that include CAGE, RAMPAGE, and related assays show why start-site annotation is cell-type-sensitive and method-dependent. 3′ end assays support cleavage and polyadenylation sites, and PolyA_DB v4 illustrates how dedicated 3′ end and long-read evidence can revise transcript-end and isoform annotation. Full-length methods that capture both ends are especially valuable, but even then, low abundance and protocol bias affect sensitivity.
Protein and translation evidence answer different questions. Ribosome profiling can show ribosome-protected fragments over a transcript region, but ribosome occupancy does not guarantee production of a stable protein. Mass spectrometry can support peptides, but many peptides are shared among isoforms. Isoform-specific protein evidence is strongest when a peptide uniquely spans an isoform-specific junction or sequence. Functional evidence is strongest when an isoform-specific perturbation changes a phenotype and a rescue experiment restores it.
Manual curation and database evidence integrate experiments but should not be treated as raw data. Curators evaluate consistency, quality, literature, sequence, and resource policy. This often produces better annotation than automated assembly alone. The tradeoff is that curation choices must be cited. A curated model is a high-value interpretation, not a natural constant.
Biological Contexts Across Organisms, Cell Types, and RNA Classes
Transcript models vary across biological contexts. In mammals, alternative promoters, alternative splicing, retained introns, alternative polyadenylation, and tissue-specific expression produce extensive isoform diversity. In plants, alternative splicing, organellar transcription, and stress-dependent RNA processing add further complexity. In fungi and protists, transcript boundaries and intron architecture can differ sharply from mammalian assumptions. In bacteria, operons and processing complicate the relationship between a gene and a mature RNA. In organelles, RNA editing and polycistronic processing mean that mature RNAs may not match simple genomic feature boundaries.
Cell type matters. A transcript model supported in brain may be absent in blood. A cancer cell state may express isoforms that are rare in normal tissue. A single-cell dataset can reveal cell-type-specific isoforms, but sparse coverage can also create false absence. Long-read single-cell approaches can connect isoform structures to cell states, as shown in colorectal cancer isoform-resolution work, but interpretation requires attention to sampling depth, cell identity, and validation.
RNA class matters. Protein-coding mRNAs have coding sequences, UTRs, and often poly(A) tails. Long noncoding RNAs can be spliced and polyadenylated yet lack a conserved coding sequence. Small RNAs often have precursor transcripts and mature processed products that need separate identifiers. Circular RNAs are formed by back-splicing and are not represented by ordinary linear transcript models alone. Readthrough transcripts, antisense RNAs, enhancer RNAs, pseudogene transcripts, and repeat-derived RNAs each need evidence standards suited to their biology. The protein-coding transcript model is useful but not universal.
Disease context matters. Disease samples can show altered promoter use, splicing, intron retention, polyadenylation, fusion transcripts, viral transcripts, allele-specific expression, or aberrant processing. Some disease-associated transcript patterns are causal. Others are consequences of cell composition, stress, proliferation, immune infiltration, tissue degradation, or technical batch effects. Transcript annotation helps identify the pattern, but disease mechanism requires additional evidence.
Technology, Computational, Clinical, and Engineering Links
Computational transcript analysis begins with annotation choices. Genome-guided transcript assembly, pseudoalignment, transcript quantification, differential transcript usage analysis, splicing analysis, and variant annotation all use transcript models. A model can be treated as a fixed reference, updated with sample-specific assembly, or compared across resources. Each choice changes sensitivity and false-positive risk. Chapter 141 covers these algorithms in detail; the essential point here is that annotation is an input, not a neutral background.
Single-cell and spatial transcriptomics add pressure to annotation. Many single-cell assays capture only 3′ or 5′ ends, which is useful for counting genes but limited for full isoform reconstruction. Spatial assays may capture partial transcripts and have lower depth. Newer long-read, targeted, or multiomic approaches can improve isoform resolution, but sample dissociation, capture bias, and sparse counts remain important. Cell-type annotation and transcript-model annotation are different tasks, even though both use RNA reads.
Isoform-resolved modification and structure assays depend on transcript models. If m6A reads, direct RNA signals, chemical-probing signals, or structure-mapping reads are assigned to the wrong isoform, a study can infer a false isoform-specific modification or structure. Isoform-aware analysis is therefore not only about expression; it affects claims about RNA chemistry and folding.
Clinical and engineering applications raise the cost of annotation error. A splice-switching oligonucleotide must target the relevant pre-mRNA region and isoform context. An antisense or siRNA drug may need to hit all pathogenic isoforms while sparing others. A diagnostic RT-PCR assay must place primers in regions that distinguish the intended transcript. A variant interpretation pipeline must know which transcript model defines the coding consequence. A synthetic biology design may depend on a UTR or coding sequence whose boundaries differ by annotation release.
Genome browsers are often the bridge between bench biology and computation. A researcher may inspect a locus, design primers, choose an exon for CRISPR editing, or compare RNA-seq tracks in a browser. The browser can make complex evidence visible quickly. The corresponding methods section must then convert the visual inspection into reproducible metadata: assembly, coordinates, track source, transcript ID, version, and files.
Recent Consensus
- Transcript models are evidence-backed annotations of RNA products, not direct observations of molecules.
- Isoforms can differ by start site, splice pattern, retained intron, exon choice, coding sequence, untranslated region, polyadenylation site, or transcript end.
- A splice junction, coverage peak, long read, ribosome signal, peptide, and phenotype support different claim types.
- Long-read RNA sequencing improves isoform reconstruction but requires controls for truncation, sequencing error, alignment ambiguity, and sampling depth.
- Transcript start and end annotations are biologically important because UTRs, first exons, terminal exons, and poly(A) sites shape regulation.
- Genome browsers integrate evidence layers; they do not eliminate the need to cite assemblies, tracks, source files, and releases.
- Coordinate systems, identifier namespaces, transcript-version suffixes, and annotation releases are part of the scientific claim when transcript identity matters.
- Transcript models drift as databases incorporate new evidence; versioned citation makes drift manageable rather than disruptive.
Open Questions, Controversies, Deprecated Models, and Common Misconceptions
Open questions:
- What evidence threshold should be required before a rare, tissue-specific, stress-specific, or disease-specific transcript becomes part of a reference annotation?
- How should annotation resources represent transcripts that are reproducible but likely to be nonfunctional decay products?
- When should long-read-supported models override conservative annotations, and when should they remain sample-specific?
- How should resources preserve obsolete transcript models without encouraging their accidental use in new analyses?
- How should transcript models represent RNA classes that do not fit linear mRNA assumptions, such as circRNAs, processed small RNAs, edited organellar RNAs, and readthrough transcripts?
- What standard should clinical workflows use when multiple resources nominate different canonical transcripts?
Common misconceptions:
- “A gene has one transcript.” Many loci produce multiple transcript products, and the dominant product can differ by cell type, condition, organism, and annotation release.
- “A transcript model is the RNA molecule.” A transcript model is an annotation claim about an RNA product.
- “A junction proves a full isoform.” A junction supports local splicing; full isoforms require evidence connecting exons and ends.
- “Transcript support proves function.” Support for a model is separate from support for translation, regulation, localization, disease causality, or phenotype.
- “The latest annotation should always replace older annotation.” Current annotations are usually best for new analyses, but reproducing an older analysis may require the historical release.
- “Genome-browser screenshots are citations.” Screenshots are illustrations. Reproducible citation requires assembly, tracks, versions, coordinates, and source files.
- “One-nucleotide coordinate errors are harmless.” One base can change splice sites, codons, editing sites, variants, primers, and therapeutic targets.