Chapter 123. Quantitative RNA Detection and Imaging: Blots, PCR, FISH, and Live-Cell Tracking
Scope Note
This chapter explains targeted RNA measurement from the physical molecule to the reported number or image. It covers size-resolved hybridization, protection assays, primer extension and rapid amplification of complementary DNA ends, reverse-transcription quantitative PCR, digital PCR, fixed-cell fluorescence in situ hybridization, and live-cell RNA reporters. The central problem is not merely detecting an RNA. It is defining which molecular population generated the signal, calibrating the response, distinguishing target from background, and matching validation to the biological claim. Genome-wide sequencing, transcriptome-scale spatial platforms, sample extraction, broad experimental design, and comprehensive RNA-end profiling have primary ownership in Chapter 125, Chapter 130, Chapter 122, Chapter 139, and Chapter 127, respectively.
Executive Summary
Every quantitative RNA assay is a measurement chain. A biological population is sampled, molecules are preserved and made accessible, a target-dependent physical or enzymatic event occurs, an instrument records signal, and an analysis model converts signal into a statement about RNA. Error can enter at every link. A bright band, low quantification cycle, fluorescent spot, or smooth trajectory is not itself an RNA abundance. It becomes evidence only after the assay’s target definition, response function, background, calibration, and uncertainty are specified.
Calibration connects signal to known input. A standard curve can reveal efficiency and usable range, while internal standards can monitor recovery or inhibition. The limit of blank describes background in target-free samples; the limit of detection concerns distinguishing low target from that background; the limit of quantification additionally requires acceptable precision and bias. These quantities depend on sample matrix, workflow, decision rule, and replicate structure. They are not permanent properties printed on an instrument.
Blotting methods retain physical size information and can expose unexpected isoforms, degradation, or cross-hybridization. Dot and slot blots trade size information for throughput. Nuclease protection uses survival of a probe-target duplex to define protected sequence, but incomplete digestion and probe design can imitate biological boundaries. Primer extension maps the 5’ end reached by reverse transcriptase, whereas rapid amplification of complementary DNA ends enriches cDNAs containing RNA termini. Both are sensitive to reverse-transcription stops, template switching, degradation, and amplification selection; a boundary supported by several independent molecules is stronger than one dominant amplicon.
RT-qPCR is sensitive and scalable, but its number is conditional on reverse transcription, primer specificity, amplification efficiency, thresholding, and normalization. A reference gene is an experimentally tested comparator, not a gene that is inherently constant. Digital PCR partitions molecules and estimates starting target concentration from the fraction of positive partitions, usually through a Poisson model. Partition counting removes dependence on a continuous amplification standard curve, but it does not remove reverse-transcription bias, target ambiguity, molecular linkage, inhibition, or sampling uncertainty.
Single-molecule fluorescence in situ hybridization (smFISH) identifies fixed-cell RNAs with multiple fluorescent probes and can support molecule counting when spots correspond to individual accessible molecules under validated conditions. Branched-DNA and related amplification schemes can increase sensitivity but change the relation between one RNA and one observed object. Multiplexing introduces optical, chemical, registration, and decoding errors that must be measured. Fixed-cell imaging preserves spatial context but captures one time point after fixation and permeabilization.
Live-cell reporters exchange directness for dynamics. Protein-binding arrays, fluorogenic RNA aptamers, molecular beacons, and programmable RNA-targeting complexes can reveal transport, confinement, localization, and disappearance in individual cells. Reporter insertion can alter RNA processing, export, translation, localization, or decay; free fluorescent components add background; illumination causes photobleaching and phototoxicity; and tracking algorithms can join or split trajectories. Endogenous fixed-cell assays, abundance measurements, functional rescue, and perturbation controls are therefore essential partners to live imaging.
Concept Inventory
- Analyte: the molecular population the assay is intended to measure, specified by sequence, isoform, end, compartment, chemical state, and sample context.
- Measurement chain: the ordered transformations from biological RNA through sampling, chemistry, signal acquisition, and inference.
- Response function: the relationship between target amount and expected measured signal over a stated range.
- Dynamic range: the interval of analyte amounts over which the assay provides a useful and characterized response.
- Limit of blank: the distribution or decision threshold expected from target-free samples under the complete assay.
- Limit of detection: the smallest analyte amount distinguishable from blank with stated error rates under specified conditions.
- Limit of quantification: the smallest amount measurable with predefined precision and bias, usually above the detection limit.
- Hybridization stringency: chemical and thermal conditions that determine how strongly probe-target complementarity discriminates against mismatches.
- Amplification efficiency: the fold increase in amplifiable product per PCR cycle under a defined assay and sample matrix.
- Quantification cycle: the cycle at which fluorescence crosses a defined threshold; often abbreviated Cq, with Ct used in some systems.
- Reference gene: an endogenous transcript tested for adequate stability in the relevant samples and used as one normalization component.
- Digital partition: a physically separated subreaction scored for target-dependent signal and used to infer the starting concentration.
- Molecule-counting regime: conditions under which detected objects can be mapped to individual target molecules with characterized misses and false positives.
- Localization precision: uncertainty in the estimated position of a fluorescent emitter or RNA-associated object.
- Tracking fidelity: accuracy with which detections are linked across frames to represent the same physical object.
- Orthogonal validation: confirmation by a method with a different measurement principle and a different dominant artifact.
What to Know Before Reading This Chapter
An RNA is a sequence-bearing polymer, but a target assay rarely sees the complete biological entity. A probe binds an accessible complementary segment. Reverse transcriptase copies the molecules it can enter and traverse. PCR counts amplifiable cDNA regions. An image detects fluorophores convolved with the microscope point-spread function. Accordingly, the phrase “the RNA level” is incomplete unless it states which sequence region, molecular form, compartment, and workflow are included.
Three running examples organize the chapter. The first is a stress-induced mammalian mRNA with a full-length product, a short degradation fragment, and a transient nuclear transcription site. The second is a low-copy viral RNA measured in respiratory specimens, where matrix inhibition and false positives near the blank dominate interpretation. The third is a localized neuronal mRNA whose particles move along processes and pause near synapses. The same target can yield a Northern band, qPCR Cq, fixed-cell spots, and live trajectories, but these outputs answer different questions.
Basic probability is also useful. Sampling molecules from a dilute specimen is stochastic. A tube with an expected mean of one target molecule will often contain zero, one, or several molecules. Digital PCR uses this principle explicitly: the number of target molecules per partition is modeled as a distribution, not inferred by equating one positive partition with exactly one original molecule. Imaging has analogous problems because two molecules may overlap within optical resolution and dim molecules may be missed.
Method standards and landmark studies provide evidence for quantitative PCR reporting, digital PCR, Northern hybridization, RACE, smFISH, multiplexed imaging, and selected live-cell reporters. No one source spans the complete measurement chain, so method-specific evidence must still be paired with general analytical reasoning and with controls matched to the specimen and claim.
123.1. Measurement models, standards, calibration, dynamic range, and detection limits
Quantitative work begins by defining the measurand: the precisely specified quantity intended to be measured. For the stress-induced mRNA, possible measurands include molecules containing a particular exon junction per cell, full-length transcripts of a defined size per microgram of total RNA, cytoplasmic spots per cell, or mobile reporter particles per micrometre of neurite. These are not interchangeable. A short qPCR amplicon can remain detectable after the rest of the transcript has degraded, and a live reporter can visualize tagged molecules without revealing untagged endogenous isoforms.
The measurement chain can be written as a causal sequence: biological state, specimen collection, preservation, extraction or fixation, target accessibility, recognition, signal generation, acquisition, segmentation or thresholding, calibration, and inference. Controls should be assigned to links rather than added as a generic list. An extraction spike-in cannot diagnose fixation-induced loss in a FISH experiment. A fluorescent bead checks illumination and focus but not probe hybridization. A no-reverse-transcriptase control tests DNA-dependent PCR signal but not primer-dimer formation. Mapping each control to a stage makes blind spots visible.
A calibration standard has an assigned amount or concentration and a defined relationship to the target. Purified synthetic RNA can calibrate reverse transcription and amplification if added before reverse transcription, but it may not model lysis, endogenous ribonucleoprotein accessibility, or degradation. A plasmid or DNA oligonucleotide bypasses reverse transcription entirely. A cultured reference sample can include matrix effects but may have uncertain target copy number. A useful calibration hierarchy therefore distinguishes instrument standards, process controls, external calibrants, internal standards, and biological references.
The response function describes how expected signal changes with analyte amount. In an ideal linear fluorescence assay, doubling target doubles signal until saturation. In qPCR, signal grows approximately exponentially during an efficiency-dependent phase and then plateaus; quantification uses the earlier range. In imaging, the response may be object count at low density but integrated intensity when spots overlap. At the lower end, background and stochastic sampling dominate. At the upper end, detector saturation, reagent depletion, overlapping spots, membrane crowding, or limited probe concentration compresses the response.
Dynamic range should be established with matrix-relevant dilution series that span the intended specimens. A curve prepared in clean buffer can miss inhibitors in tissue lysate or autofluorescence in fixed sections. Dilution can sometimes reveal inhibition when measured concentration does not scale as expected, but dilution also changes sampling noise and may move the target below detection. Replicates should separate technical repeatability from biological variation. Repeated readings of one well estimate acquisition noise; independent reverse transcriptions estimate a larger portion of the workflow; independently collected samples estimate biological variability.
The limit of blank, limit of detection, and limit of quantification answer different questions. Blank measurements define the target-free signal distribution and expose contamination or nonspecific recognition. Detection requires a decision rule with controlled false-positive and false-negative probabilities. Quantification adds an acceptance criterion for bias and imprecision. At very low copy number, a nominal concentration may be detectable across many replicates yet not reliably quantified in one specimen. The correct report states the complete workflow, matrix, number of replicates, decision threshold, uncertainty, and treatment of nondetects.
Normalization changes the target quantity. Copies per cell, copies per unit tissue area, copies per nanogram of total RNA, and ratios to a reference transcript have different denominators. If treatment globally reduces RNA content per cell, normalization to equal total RNA can conceal the global shift. If cell size changes, spots per cell and spots per area can disagree. Standards support comparability only when their placement and denominator match the claim.
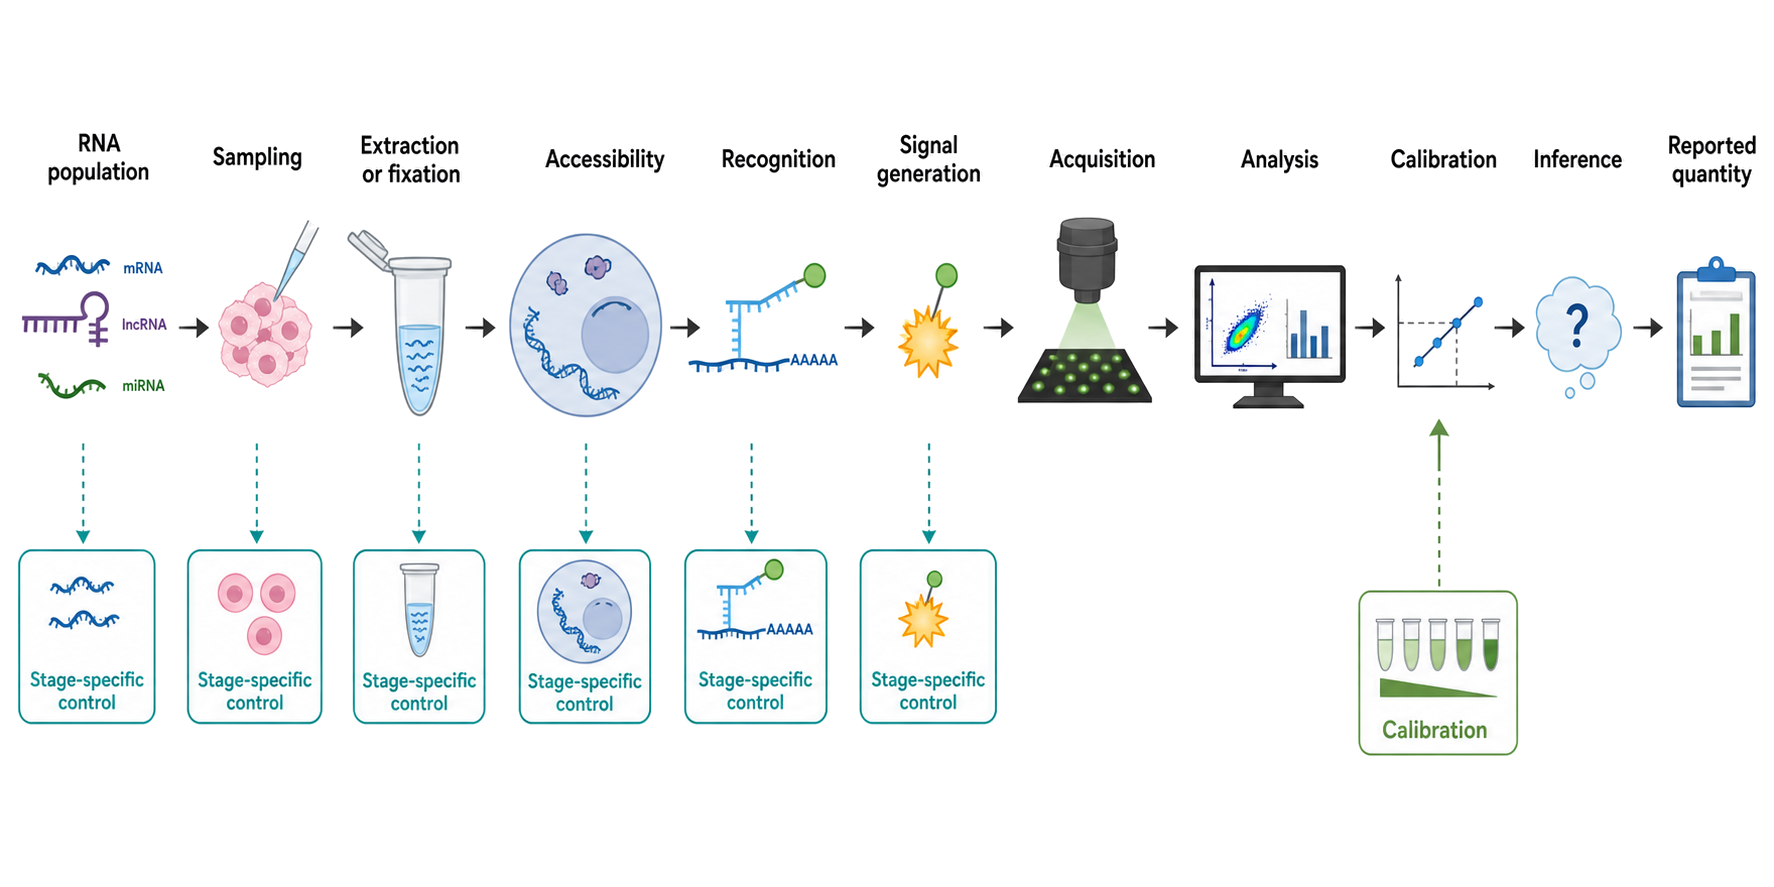
Figure 123.1. From RNA population to reported number or image. “An RNA measurement is a chain. Standards and controls diagnose only the stages they experience, and the reported quantity depends on the response model and denominator.”
Table 123.1. Analytical-performance terms and the evidence needed to report them. Prevent detection, quantification, range, and precision from being conflated.
| Term | Operational question | Required evidence | Common misuse |
|---|---|---|---|
| Limit of blank | What signal arises with no target? | Matrix-matched target-free replicates through the complete workflow | Using instrument zero or buffer alone |
| Limit of detection | What low amount is distinguishable from blank at stated error rates? | Low-level samples, blank distribution, decision rule, replicate design | Calling the lowest observed positive the LoD |
| Limit of quantification | What low amount meets precision and bias criteria? | Calibrated low-level series and predefined acceptance criteria | Treating every detected target as precisely quantitative |
| Dynamic range | Over what interval is the response useful? | Matrix-relevant dilution series spanning lower and upper limits | Extrapolating beyond calibrated inputs |
| Repeatability | How variable are repeats under nearly identical conditions? | Same-sample technical repeats | Calling technical repeats biological replication |
| Reproducibility | How stable is the result across meaningful changes? | Operators, days, lots, instruments, or laboratories as appropriate | Assuming one plate establishes portability |
The evidence handoff is straightforward: Chapter 122 owns recovery and sample qualification; Chapter 139 owns study-wide replication, randomization, and statistical design; this chapter owns the assay response between target and readout. Chapter 5 provides the broader rule that evidence strength depends on whether alternatives were actually excluded.
123.2. Northern, dot and slot blots, nuclease protection, and size-resolved detection
A Northern blot separates RNA molecules by electrophoretic mobility, transfers them to a membrane, and detects complementary sequences by probe hybridization. Its distinguishing strength is the combination of sequence recognition and apparent size. For the stress-induced mRNA, a band at the expected full-length position supports a different claim than qPCR amplification of a 90-nucleotide internal segment. Extra bands can reveal alternative processing, precursor RNA, cleavage products, cross-hybridization, or degradation, although mobility alone does not identify which explanation is correct.
The physical chain matters. RNA must enter the gel without selective loss, remain sufficiently denatured to migrate according to length, transfer efficiently across the relevant size range, become immobilized, hybridize to probe, survive washing, and generate signal within the detector’s range. Large structured RNAs may transfer inefficiently; short RNAs may pass through or wash away unless membrane chemistry and crosslinking are adapted. Formaldehyde or other denaturing conditions reduce structure-dependent migration for long RNA, while urea-polyacrylamide gels provide higher resolution for short RNAs. An RNA ladder estimates size but does not control transfer or hybridization.
Probe design determines specificity and sensitivity. Long probes provide many labels and strong signal but can cross-hybridize through shared domains or repeats. Oligonucleotide probes can distinguish short regions or single-nucleotide changes under optimized stringency, but carry fewer labels. Hybridization stringency depends on temperature, salt, denaturant, probe length, base composition, and mismatch position. A clean band at low stringency is not equivalent to a sequence-validated product. Probe competition, multiple nonoverlapping probes, and target perturbation can strengthen identity.
Quantification requires operation below membrane and detector saturation. Band intensity should be background-corrected with a documented region and compared within a calibrated response interval. A loading control must be stable, transferred in the same useful range, and measured without saturation. Ribosomal RNA staining reports bulk RNA loading but may not correct selective mRNA loss or transfer. Exogenous standards added before extraction report more stages but only if their recovery resembles the target. Densitometry cannot turn an uncalibrated band into an absolute molecule count.
Dot and slot blots immobilize samples without electrophoretic separation. They enable many samples and can test presence or relative signal, but they discard size information. A degraded fragment, full-length RNA, and off-target transcript carrying the recognized sequence can contribute together. Dot blots are therefore strongest when the molecular identity is established independently or when the question is total sequence-bearing material rather than transcript architecture.
Nuclease protection assays hybridize a labeled probe to RNA and digest unpaired regions. The protected fragment is then separated and detected. Protection can quantify a target and distinguish boundaries or splice forms when the probe architecture makes different duplexes yield different lengths. Yet protection is a biochemical selection, not a direct photograph of an RNA end. Incomplete nuclease digestion creates longer products; excessive digestion can nibble imperfect duplexes; probe self-structure and target accessibility alter hybridization; genomic DNA can survive unless controlled; and closely related transcripts can share protected sequence.
The decisive controls include a size marker, target-free biological matrix, probe-only digestion control, positive target, loading or process standard, and a specificity perturbation when feasible. For claims about transcript size, a second probe elsewhere in the molecule or an independent end assay is especially valuable. For rare targets, long exposures can reveal background bands and detector nonlinearity; presenting only a cropped region hides relevant evidence.
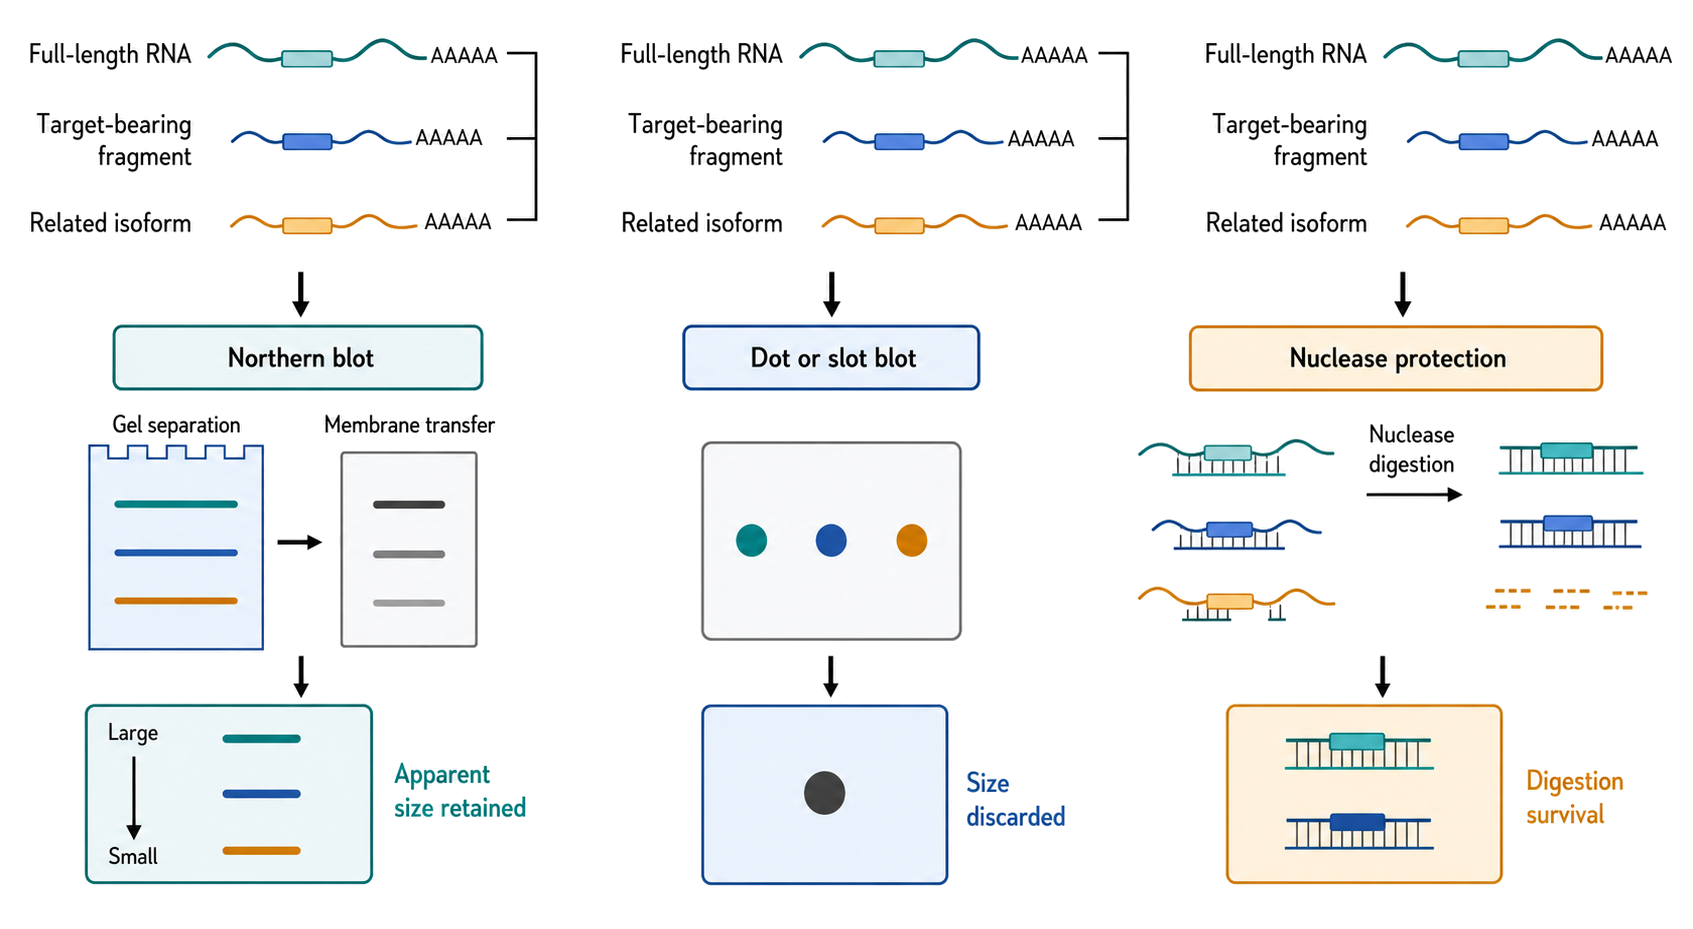
Figure 123.2. What blotting and nuclease protection retain or discard. “Northern blotting preserves apparent size before hybridization, dot and slot blots collapse all target-region signal, and protection assays report duplexes that survive digestion.”
Table 123.2. Hybridization and protection assay comparison. Match the assay output to the claim.
| Assay | Physical selection | Retained information | Principal artifacts | Strong use |
|---|---|---|---|---|
| Northern blot | Electrophoretic mobility plus probe hybridization | Apparent size and target-region signal | Transfer bias, cross-hybridization, saturation | Validate expected and unexpected RNA sizes |
| Dot or slot blot | Immobilization plus probe hybridization | Total target-region signal | No size identity, uneven loading, background | Screen many samples after identity is established |
| Nuclease protection | Duplex formation plus digestion survival | Protected-fragment length and abundance | Incomplete digestion, nibbling, probe structure | Distinguish predefined boundaries or splice forms |
| Direct stain | Dye interaction with bulk RNA | Loading and broad size profile | Limited sequence specificity, saturation | Loading and integrity context |
Blots remain useful precisely because they preserve information that amplification discards. They do not compete with sequencing for transcriptome breadth; they provide targeted physical evidence about size and sequence-bearing products. Chapter 125 treats standard sequencing-based abundance and isoform discovery, while Chapter 127 treats high-throughput end capture.
123.3. Primer extension, RACE, targeted RNA-end mapping, and boundary validation
Primer extension begins with a labeled or otherwise detectable DNA primer annealed downstream of a candidate RNA 5’ end. Reverse transcriptase extends toward the end of the template; the product length, resolved against a size reference, estimates where copying stopped. When RNA is intact and the enzyme reaches the true end, the product supports a boundary. The same product can also arise from a strong RNA structure, base modification, damage, protein obstacle, or premature enzyme dissociation. Primer extension therefore maps reverse-transcriptase stops, only some of which are RNA ends.
Primer choice defines which RNAs are eligible. A primer in a shared exon may copy several isoforms; an isoform-specific primer can improve selectivity but may miss unanticipated products. Annealing temperature and accessibility affect entry. Reverse transcriptases differ in processivity, terminal behavior, modification sensitivity, and template-switching propensity. A sequencing ladder or calibrated size marker must be aligned accurately, and single-nucleotide interpretation requires appropriate resolution. Replicate reactions with a second primer or enzyme help distinguish a persistent end from an enzyme-specific pause.
Rapid amplification of cDNA ends (RACE) converts RNA boundaries into amplifiable cDNA junctions. In 5’ RACE, an adapter or template-switch-derived sequence is associated with the cDNA end so a gene-specific primer can amplify molecules that reached the boundary. In 3’ RACE, an adapter-bearing primer often uses a poly(A) tail or ligated adapter to recover downstream sequence. The exact chemistry determines the population. A poly(A)-primed assay excludes nonpolyadenylated ends and may prime internally at A-rich sequence. A ligation-dependent assay selects termini compatible with the ligase and end chemistry. Template switching can create junctions not present in the original RNA.
Amplification changes representation. A rare cDNA with favorable length and primer compatibility can dominate the final clones, whereas a common structured or long isoform may be missed. PCR duplicates do not provide independent molecule counts unless unique molecular identifiers or other provenance is introduced before amplification. Cloning a few products reveals possible ends, not their population frequency. Deep amplicon sequencing improves sampling but still measures the products admitted by reverse transcription, end capture, and PCR.
Boundary validation should combine evidence with different failure modes. For the stress-induced transcript, one can compare primer extension, 5’ RACE, a size-resolved Northern blot with two probes, and transcriptome data that show capped or nascent signal near the candidate start. A promoter perturbation or targeted sequence change can test causality. Agreement among assays is persuasive only if they do not share the same degraded input or reverse-transcription stop. RNase-protection and ligation-based evidence provide useful orthogonality because their chemistry differs.
Targeted end assays must also state the biochemical end being captured. RNA can carry a 5’ triphosphate, monophosphate, hydroxyl, cap, protein linkage, or cyclic phosphate; 3’ ends can have hydroxyl, phosphate, aminoacylation, poly(A), uridylation, or other modifications. Enzymatic pretreatment can convert these states and thereby alter eligibility. A mapped “end” may be a mature processing boundary, decay intermediate, transcription start or termination product, or damage product. Cell compartment and RNA age further qualify the claim.
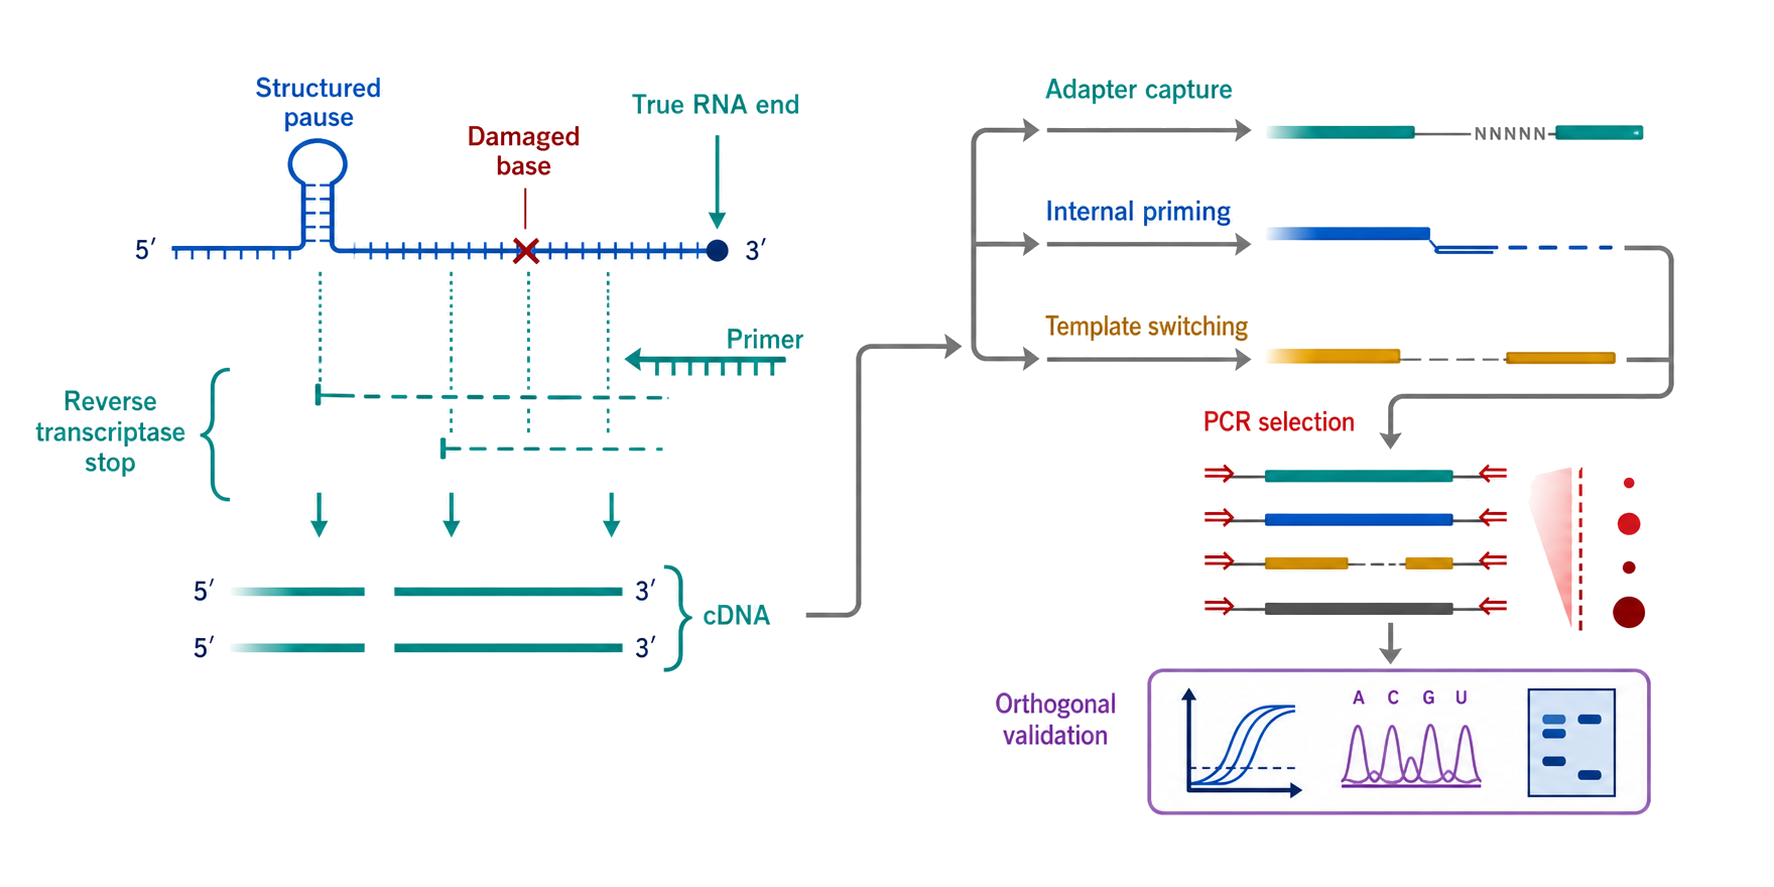
Figure 123.3. Selection chain in primer extension and RACE. “Primer extension reports where reverse transcriptase stops. RACE adds end capture and amplification, so natural boundaries must be distinguished from chemistry- and enzyme-dependent products.”
Classical 5’ RACE protocols provide a foundation for targeted end recovery, but no single end-mapping chemistry captures every terminal state without selection. Comparative treatment of multiple RACE chemistries, ligation biases, and end-state enzymology therefore remains an evidence need. This section establishes the measurement logic and hands transcriptome-scale end profiling and end-chemistry atlases to Chapter 127, while specialized small and stable-RNA recovery belongs to Chapter 126, rather than treating RACE as comprehensive end biology.
123.4. Reverse-transcription qPCR, digital PCR, reference genes, and absolute quantification
Reverse-transcription quantitative PCR transforms RNA into complementary DNA and measures target-dependent fluorescence during amplification. The workflow contains at least two enzymatic response functions. Reverse transcription determines which RNA molecules produce amplifiable cDNA, and PCR determines how those cDNAs accumulate. A low Cq can reflect abundant RNA, efficient priming, a short favorable amplicon, DNA contamination, or nonspecific product. MIQE reporting principles emphasize that sample handling, RNA quality, reverse transcription, primer sequences, efficiency, controls, normalization, and analysis choices are part of the result rather than optional technical detail.
Reverse transcription can use oligo(dT), random primers, gene-specific primers, or mixtures. Oligo(dT) enriches polyadenylated RNA but is sensitive to tail accessibility, degradation, and internal priming. Random primers sample many RNAs but do not prime uniformly and can copy abundant rRNA. Gene-specific priming can improve sensitivity for a small panel while making each target’s reverse-transcription reaction different. Structure, modifications, inhibitors, and distance from the priming site create target-specific yield. Technical replicates of PCR from one cDNA do not measure this reverse-transcription uncertainty.
Primer and probe design determines molecular meaning. An exon-junction primer can reduce genomic DNA amplification but may select one splice form. Primers within a shared exon measure all compatible isoforms. A hydrolysis probe adds sequence recognition inside the amplicon; an intercalating dye reports any double-stranded product and therefore requires melting-curve and product validation. Amplicon sequencing or gel sizing can confirm identity, especially in new assays. No-reverse-transcriptase and no-template controls test different contamination routes and both are needed when signal approaches the blank.
During the exponential working range, an ideal PCR doubles product each cycle, but actual efficiency varies. Standard-curve slope can estimate efficiency over a concentration interval, while serial dilution can reveal inhibition or nonparallel behavior. Relative quantification based on Cq differences assumes adequately similar and stable efficiencies. The familiar comparative-Cq calculation does not rescue a poor primer pair, changing efficiency, or unstable denominator. Threshold placement and baseline subtraction should be consistent and documented.
A reference gene is selected empirically for a context. Housekeeping function does not guarantee invariant RNA abundance. Cell-cycle shifts, differentiation, stress, infection, hypoxia, changes in cell composition, and global transcriptional responses can alter common reference transcripts. Multiple candidate references should be evaluated across the actual conditions, and geometric combination can be more robust than one comparator when the candidates are independent and stable. External standards or per-cell normalization may be necessary when total RNA per cell changes.
Absolute quantification uses a calibration model to report copies or concentration. RNA standards experience reverse transcription; DNA standards do not. In vitro transcripts can differ from endogenous RNA in structure, modification, fragmentation, and matrix context. Assigned concentration itself has uncertainty. Reporting “copies per cell” additionally requires cell count, extraction recovery, elution volume, sampled fraction, and losses. An absolute-looking integer can therefore carry substantial model uncertainty.
Digital PCR divides a reaction into many partitions and scores each as positive or negative after endpoint amplification. If molecules enter partitions independently, the positive fraction estimates the mean occupancy through a Poisson model; correction accounts for partitions that initially received more than one target molecule. Confidence intervals reflect the number and occupancy of accepted partitions. Useful precision deteriorates when nearly all partitions are negative or positive, so sample dilution and target range remain design decisions.
Digital PCR removes dependence on a continuous external amplification curve but not on upstream conversion from RNA to cDNA. It also retains assay-specific ambiguity, inhibition near classification thresholds, partition-volume uncertainty, molecular linkage, droplet rain, contamination, and sampling error. Duplex assays can test linkage or ratios, but linkage must be interpreted with fragmentation and cDNA architecture. For rare viral RNA, multiple independent extractions and matrix-matched blanks can matter more than the nominal decimal precision of the dPCR output.
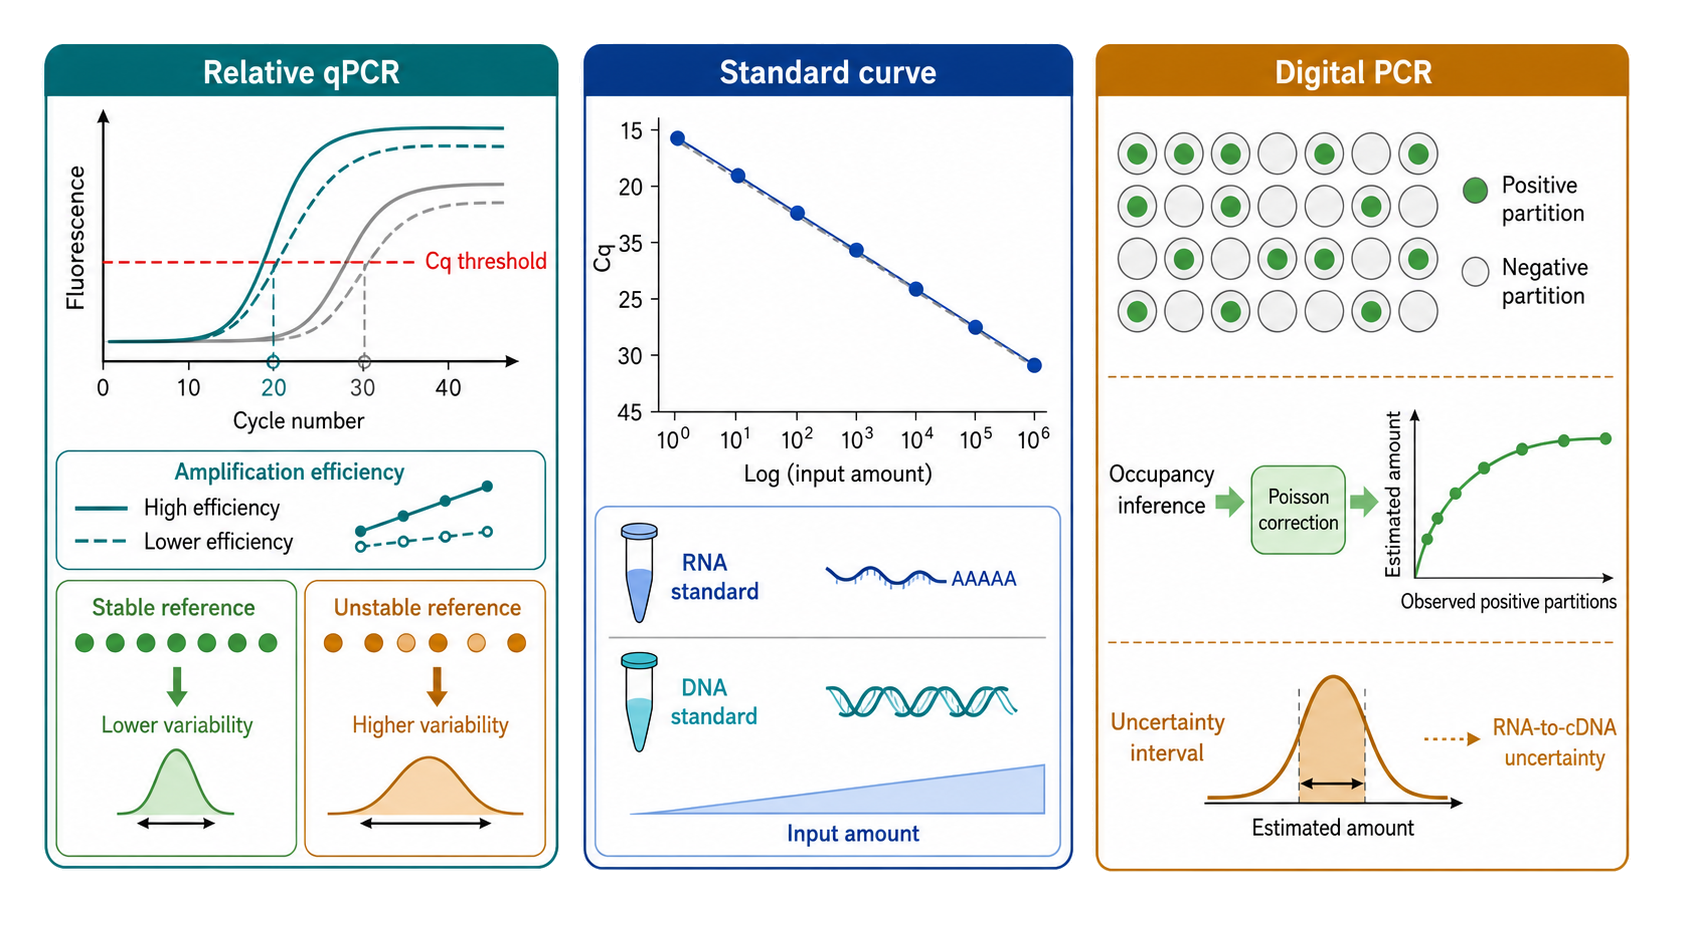
Figure 123.4. Relative qPCR, standard-curve quantification, and digital occupancy. “Relative qPCR depends on efficiency and a valid denominator; standard-curve quantification inherits calibrant behavior; digital PCR infers occupancy from partition fractions but retains upstream RNA-to-cDNA uncertainty.”
Table 123.3. Controls for RT-qPCR and RNA digital PCR. Show why common controls are complementary.
| Control or standard | Tests | Does not test | Failure interpretation |
|---|---|---|---|
| No-template control | Reagent and setup contamination; primer dimers | Extraction contamination or sample DNA | Investigate setup, reagent, or aerosol route |
| No-reverse-transcriptase control | DNA-dependent target signal | RNA contamination requiring RT | Improve DNase, assay placement, or target definition |
| Positive process control | Gross workflow failure and inhibition | Specificity or false positives | Distinguish failed chemistry from absent target |
| RNA standard | RT plus amplification response | Endogenous recovery unless added early | Use within characterized matrix and range |
| DNA standard | PCR response | Reverse-transcription yield | Do not present as full RNA-process calibration |
| Reference genes | Relative denominator | Absolute copies or global RNA-per-cell change | Validate across actual biological conditions |
| Replicate extraction | Recovery and low-copy sampling variation | Shared systematic bias | Report zero inflation and between-extraction uncertainty |
RT-qPCR and dPCR are targeted assays. They are strong for predefined sequences, validation cohorts, clinical decision rules, and perturbation follow-up. They do not reveal unexpected isoforms outside the amplicon. Chapter 125 owns discovery-scale sequencing, while Chapter 139 owns power, multiplicity, and cohort-level inference.
123.5. smFISH, branched-DNA assays, multiplexed fixed-cell imaging, and molecule counting
Fluorescence in situ hybridization detects RNA by annealing fluorescent probes in fixed, permeabilized cells or tissues. In single-molecule FISH, many singly labeled oligonucleotides bind along one target RNA. Their combined fluorescence forms a diffraction-limited spot that can be separated from most unbound-probe background. When detection efficiency, spot segmentation, overlap, and false positives are characterized, each spot can approximate one RNA molecule. The strength is simultaneous abundance and position in intact cellular geometry.
Fixation and permeabilization define the accessible population. Crosslinking can preserve morphology but mask sequence or immobilize molecules incompletely. Alcohol fixation changes membranes and structure differently. Permeabilization must admit probes without extracting RNA. Tissue autofluorescence, extracellular matrix, lipofuscin, heme, and fixation-induced fluorescence add spatially nonuniform background. A protocol validated in cultured cells cannot be assumed to count molecules in a thick clinical section.
Probe sets should avoid repeats, highly homologous transcripts, common variants, and inaccessible regions. Multiple probes confer specificity because a spot requires colocalized binding events, yet partial probe-set binding can still detect truncated RNA. Split probe sets labeled in different colors provide a direct specificity test: true molecules should colocalize above chance after registration error is considered. Target knockout, depletion, or sequence deletion provides stronger negative evidence than a no-probe image alone. RNase treatment tests RNA dependence but can alter morphology and background.
Counting requires a calibrated image-analysis model. The microscope spreads one emitter into a point-spread function. Several fluorophores on one RNA create a spot whose intensity varies with labeling, focus, local environment, and bleaching. Thresholding too high misses dim molecules; thresholding too low calls background. Closely spaced RNAs merge, especially at transcription sites or in dense compartments. Optical section thickness, z sampling, edge exclusion, cell segmentation, and channel registration all influence counts. A molecule-count claim should report detection efficiency or at least sensitivity analysis across plausible thresholds.
Bright nuclear foci often represent transcription sites containing several nascent RNAs rather than one molecule. Integrated intensity relative to cytoplasmic single-RNA spots can estimate the number of engaged transcripts only under assumptions about probe occupancy and nascent transcript length. Cytoplasmic spots can include full-length molecules, fragments carrying probe sites, or clustered RNAs. The neuronal mRNA example illustrates why position matters: enrichment near a synapse can arise from more RNA, a smaller local compartment, changed cell morphology, or segmentation choices.
Branched-DNA assays use hierarchical hybridization scaffolds to recruit many labels per target recognition event. The amplification is physical rather than enzymatic and can enable detection of low-abundance RNA or fewer target-specific probe pairs. However, a larger fluorescent object is not automatically one molecule. Assembly efficiency, nonspecific scaffold binding, local saturation, and merging determine the response. Calibration with known target abundance and comparison to nonamplified smFISH are needed before interpreting spot number absolutely.
Multiplexed fixed-cell imaging can use spectrally distinct probes, sequential hybridization, combinatorial barcodes, or in situ decoding. Multiplexing scales biological coverage but introduces barcode misread, incomplete stripping, carryover, tissue drift, registration error, cycle-dependent loss, optical crowding, and codebook-dependent false assignment. Blank barcodes and negative targets estimate false calls; repeated targets estimate reproducibility; fiducials support registration; and a subset validated by conventional smFISH anchors identity. Transcriptome-scale spatial technologies and their computational integration belong to Chapter 130, while this chapter retains the molecule-level measurement logic.
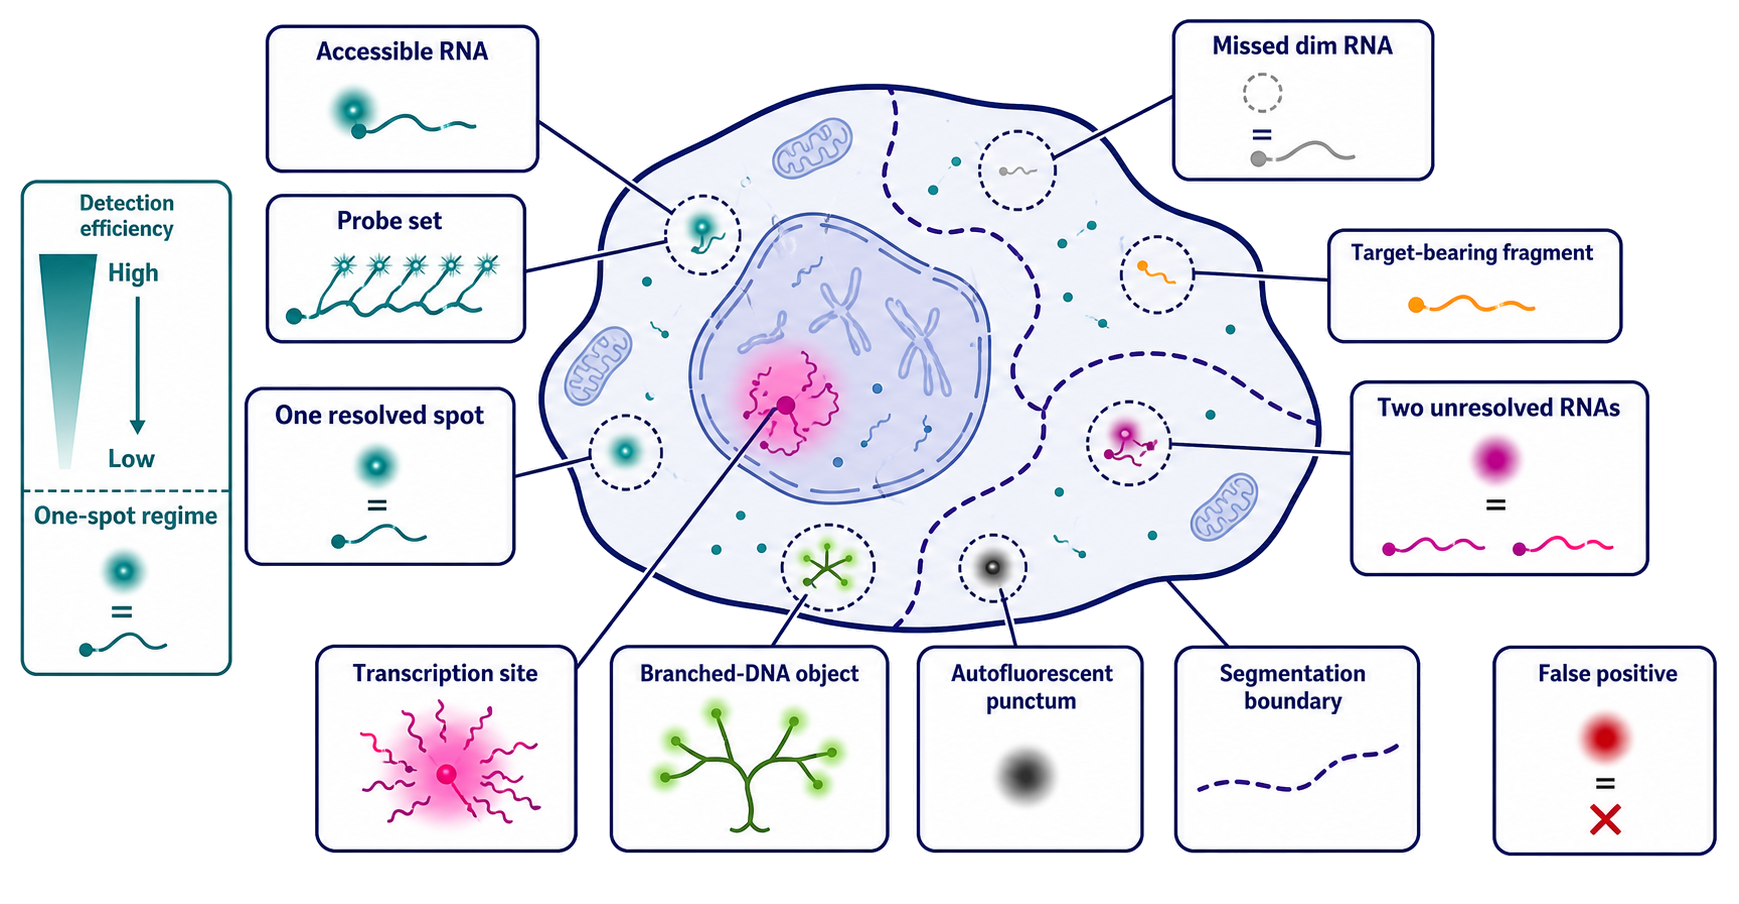
Figure 123.5. When a fluorescent spot is and is not one RNA. “A spot-to-molecule mapping requires calibrated detection efficiency, overlap, specificity, and segmentation. Bright or amplified objects and fragments require different interpretations.”
Table 123.4. Fixed-cell imaging failure modes and diagnostics. Pair each apparent image feature with a discriminating test.
| Apparent feature | Alternative explanation | Diagnostic control | Reporting requirement |
|---|---|---|---|
| Single spot | Background punctum or fragment | Target depletion and split probe sets | Threshold sensitivity and false-positive estimate |
| Missing spot | Inaccessibility or low photons | Positive control and spike target | Detection efficiency by compartment or depth |
| Bright focus | Several RNAs or transcription site | Intensity comparison and intron/exon probes | Avoid one-focus-one-molecule count |
| Colocalization | Chance overlap and registration error | Shifted-channel null and fiducials | Distance criterion and registration uncertainty |
| Spatial enrichment | Cell geometry or segmentation bias | Alternative masks and per-volume denominator | Segmentation procedure and excluded regions |
| Multiplex identity | Carryover or barcode error | Blank codewords and repeated targets | Per-cycle loss and decoding error |
Fixed-cell imaging is particularly valuable in embryos, polarized cells, microbial communities, and heterogeneous tissues where bulk abundance loses spatial context. Its boundary is time: each cell is captured after fixation, and a population series is not a trajectory of one molecule. Live imaging addresses that question at the cost of reporter perturbation and lower molecular directness.
123.6. Live-cell RNA reporters, tracking, localization dynamics, and perturbation artifacts
Live-cell RNA imaging requires a target-dependent fluorescent state that persists long enough to record. Protein-binding systems insert repeated RNA hairpins into a transcript and express fluorescent RNA-binding proteins. Fluorogenic aptamers such as Mango bind small-molecule dyes and increase fluorescence. Molecular beacons change conformation upon hybridization. Programmable RNA-targeting proteins or CRISPR-associated complexes can be directed to endogenous RNA. Each strategy defines a different balance among brightness, background, target modification, occupancy, and endogenous applicability.
Repeated binding-site arrays provide many fluorophores and therefore high sensitivity, but the array becomes part of the RNA. It can change transcript length, secondary structure, nuclear export, translation, localization, ribonucleoprotein composition, and decay. Incomplete degradation can leave a labeled fragment whose movement no longer represents the full transcript. The correct control compares tagged and untagged abundance, size, localization, translation, and lifetime; demonstrates expected biological function; and tests whether reducing array length or protein expression changes behavior.
Fluorogenic aptamers reduce background because unbound dye is dim, yet aptamer folding and dye binding depend on ionic environment, temperature, neighboring sequence, and cellular compartment. Arrays again increase signal while increasing structural burden. The Mango II method supports one implementation, not a general claim that every aptamer is nonperturbing. Programmable CRISPR-Csm imaging can target endogenous transcripts without inserting a large array, but delivery, guide occupancy, target accessibility, complex size, potential cleavage or binding effects, and off-target fluorescence remain relevant.
The microscope adds a second perturbation. Excitation light bleaches fluorophores and can damage cells through reactive photochemistry. Faster imaging improves temporal resolution but increases exposure and reduces photons per frame. Longer exposures localize dim spots more precisely but blur fast motion. Three-dimensional imaging reduces out-of-plane loss but increases cycle time and light dose. A valid acquisition schedule is chosen from the biological time scale and supported by phototoxicity controls, not merely by the fastest camera setting.
Tracking converts detections into trajectories. The algorithm predicts which spot in the next frame is the same RNA, often using distance, intensity, and motion models. At high density, particles cross and identities can swap. Blinking or temporary loss breaks a trajectory; permissive gap closing can join unrelated objects. Appearance and disappearance can mean synthesis, entry into the focal volume, movement below threshold, bleaching, degradation, or reporter dissociation. Simulated tracks and manually curated subsets can benchmark performance, while sensitivity analysis across linking parameters exposes fragile conclusions.
Motion is not automatically active transport. Free or hindered diffusion, confinement, cytoplasmic flow, motor-driven runs, and binding transitions can produce overlapping displacement distributions at finite frame rate. Mean-squared displacement summaries are sensitive to localization error, track length, motion heterogeneity, and time averaging. Directional runs along a neurite become stronger evidence for motor-dependent transport when they align with cytoskeletal polarity, change after acute motor perturbation, and recover with rescue. Colocalization with an organelle or granule requires a null model for chance overlap in the same constrained geometry.
Reporter occupancy also changes interpretation of intensity. A brighter particle can contain more RNA, more bound reporter per RNA, several unresolved RNAs, or a favorable optical position. Calibration against fixed-cell smFISH can connect live particles to endogenous copy number and identify labeled fragments. RT-qPCR or Northern blot can test abundance and size. Translation reporters can reveal local protein production, but adding a second reporter changes the construct and requires its own validation.
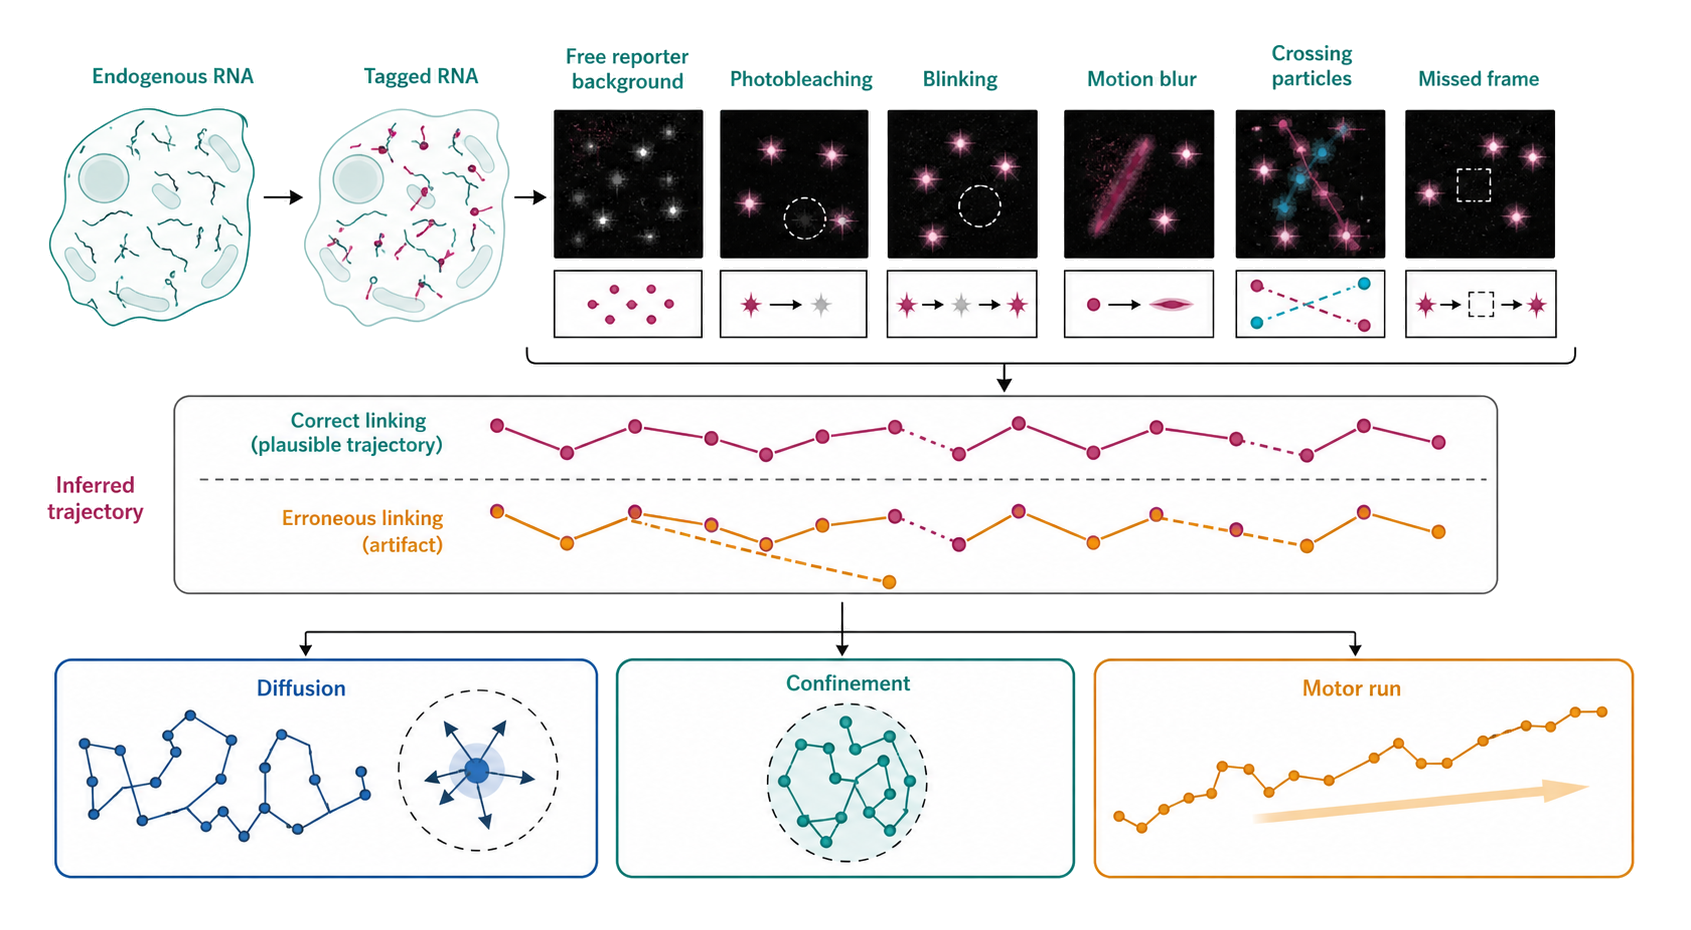
Figure 123.6. Reporter, microscope, and tracker perturb the observed trajectory. “A trajectory is inferred from reporter-associated detections. Reporter burden, optics, and linking choices can alter both the molecule and the path assigned to it.”
Box 123.1. Audit any reported RNA number
- Required questions: What molecule is eligible? Which stages occurred before the standard was added? What is the response range? What blank defines a false positive? What denominator is used? What uncertainty is included? Could a fragment generate the same signal? Which independent method excludes the leading alternative?
- Misconception prevented: A precise numerical output is automatically an accurate biological quantity.
Live reporters are most informative when dynamics are the claim: transcriptional bursts, transport velocities, dwell times, compartment exchange, or disappearance. They are weakest when a static endogenous assay could answer the question without genetic or chemical perturbation. Biological mechanisms of localization and local translation belong to Chapter 39 and related pathway chapters; this section owns the measurement and tracking logic.
123.7. Controls, background, specificity, imaging artifacts, and orthogonal validation
Controls are experimental contrasts that identify failure modes. A negative control is useful only if it could reveal the suspected signal route. No-template PCR controls detect contamination introduced after extraction but not genomic DNA in a sample. A scrambled FISH probe may have different base composition and structure from the target set. An untagged cell reports free reporter background but not perturbation caused by the tagged RNA. A complete control architecture follows the measurement chain and includes target-free, chemistry, process, acquisition, and analysis controls where relevant.
Background can be additive, target-like, or structural. Additive background includes membrane haze, autofluorescence, detector offset, and unbound dye. Target-like background includes off-target amplicons, cross-hybridized bands, nonspecific fluorescent spots, and contaminating nucleic acid. Structural background arises when tissue geometry or cell segmentation creates apparent enrichment. Subtracting a mean background can address some additive signal but cannot correct a false target or biased segmentation. Background distributions, not just averages, determine decision thresholds.
Specificity requires demonstrating that signal depends on the intended RNA feature. Sequence-based evidence includes nonoverlapping probe agreement, product sequencing, melting behavior, expected protected fragment, and loss after target sequence deletion. Biological evidence includes target depletion, induction, compartment change, or genetic rescue. Each can fail: depletion can have indirect effects, and overexpression can saturate specificity. The strongest combination joins molecular identity with a predicted biological response.
Imaging artifacts deserve explicit classification. Uneven illumination creates position-dependent intensity. Chromatic aberration and registration error create false noncolocalization or colocalization. Out-of-focus light merges spots; deconvolution can sharpen noise. Maximum-intensity projections discard depth and can manufacture overlap. Segmentation errors reassign spots between cells or compartments. Photobleaching imitates loss; blinking imitates disappearance and reappearance; motion blur biases against fast particles. Image processing should be applied consistently, with parameters and exclusions recorded before condition labels are interpreted.
Amplification artifacts are equally consequential. Reverse-transcription stops and template switching alter cDNA boundaries. Primer dimers and off-target PCR products produce fluorescence. PCR plateau behavior destroys quantitative proportionality. Digital partitions near the fluorescence threshold create ambiguous “rain.” Probe amplification trees can merge or assemble incompletely. A method is not protected from artifact merely because it is called digital or single-molecule.
Orthogonal validation is strongest when it measures a different physical consequence. A qPCR change can be supported by a size-resolved Northern blot, not merely by a second qPCR amplicon. An smFISH localization can be supported by biochemical fractionation with contamination markers. A live trajectory can be anchored by endogenous fixed-cell spots, size and abundance assays, and functional rescue. A RACE-defined end can be supported by primer extension and ligation-based data. Agreement among methods sharing reverse transcription or the same probe sequence is useful but less independent.
Blinding and automation do not automatically remove bias. A segmentation model can encode choices from labeled training images; a threshold optimized after viewing group differences can exaggerate separation. Predefined pipelines, masked manual review, held-out images, negative barcodes, and sensitivity analysis improve credibility. Representative images should accompany distributions across biological replicates, fields, and cells. Technical replication cannot substitute for independently sampled biological units.
Table 123.5. Match orthogonal validation to the claim. Select evidence that excludes the main alternative.
| Claim | Primary observation | Strong orthogonal evidence | Main alternative to exclude |
|---|---|---|---|
| Full-length RNA increased | Internal RT-qPCR amplicon | Unsaturated Northern with nonoverlapping probes | Stable fragment or altered RT yield |
| A specific 5’ end exists | 5’ RACE product | Primer extension plus independent end chemistry | Template switching or RT stop |
| RNA copy number changed | smFISH spots | Calibrated RT-qPCR/dPCR with per-cell denominator | Threshold or morphology change |
| RNA is enriched in a compartment | Fixed-cell localization | Fractionation with contamination markers | Geometry, leakage, or segmentation |
| RNA undergoes directed transport | Live trajectories | Acute motor perturbation, rescue, and cytoskeletal alignment | Diffusion, flow, or linking errors |
| Reporter preserves endogenous behavior | Tagged live RNA | Endogenous size, abundance, localization, function, and lifetime | Reporter burden or labeled fragment |
The final report should state analyte definition, sample history, assay chemistry, standards and placement, response range, blanks, detection rule, replicate hierarchy, exclusions, normalization denominator, uncertainty, and raw-data availability. For imaging it should additionally state microscope settings, optical sampling, segmentation and tracking parameters, phototoxicity assessment, and whether images are projections or sections. Such reporting does not guarantee validity, but it lets readers identify which claims the experiment can support.
Experimental Foundations and Evidence
The assay families in this chapter rest on distinct physical foundations: electrophoretic separation plus hybridization, duplex protection, reverse-transcriptase traversal, exponential amplification, stochastic partition occupancy, spatially resolved probe binding, and fluorescence tracking. Their outputs should therefore be treated as complementary. Size-resolved detection asks whether a recognized sequence resides in a molecule of a particular apparent length. PCR asks how many molecules yielded an amplifiable region under a conversion model. FISH asks where accessible target-bearing objects were fixed. Live imaging asks how reporter-associated objects changed during observation.
Evidence is strongest when calibration samples traverse the same relevant stages as specimens, blank and positive samples bound the decision, and a different assay tests the main alternative. MIQE and dMIQE guidance supports transparent qPCR and dPCR reporting; foundational Northern, 5’ RACE, smFISH, MERFISH, MS2, Mango II, and CRISPR-Csm studies establish specific method implementations.
Biological Contexts Across Organisms, Cell Types, and Perturbations
No single assay behaves identically across biological systems. Bacterial transcripts can be short-lived, polycistronic, and uncoupled from eukaryotic polyadenylation assumptions. Plant tissues add walls, pigments, and autofluorescent compounds. Neurons impose long processes and spatially restricted translation. Embryos and tissues require three-dimensional segmentation and account for changing cell size. Viral assays may operate near a clinical decision threshold and must distinguish replication products from residual input or contamination. Modified tRNAs and structured RNAs challenge reverse transcription and probe accessibility.
Perturbations can change the denominator as well as the target. Stress may alter total RNA per cell, cell volume, morphology, reference genes, autofluorescence, and reporter expression. Infection changes cell composition and nucleic-acid background. Differentiation changes ploidy and cell size. Reporting assay results in several defensible units, and checking whether conclusions survive those choices, prevents a technical denominator from becoming a biological mechanism.
Technology, Computational, Clinical, and Engineering Links
Targeted assays are engineering systems with tunable recognition, amplification, optics, and decision rules. Clinical tests require matrix-specific validation, contamination control, lot tracking, stable calibrators, and prespecified thresholds. Synthetic biology uses RNA tags and fluorogenic aptamers to monitor engineered circuits, but the reporter becomes part of the circuit. Automated image analysis can scale phenotyping, while model validation must distinguish biological generalization from reuse of the same imaging conditions.
Computational improvements cannot restore information the chemistry never captured. A neural network can improve spot detection in characterized data but cannot determine whether a spot is full-length RNA without training evidence that links appearance to molecular state. A fitted standard curve can interpolate within its validated range but should not legitimize extreme extrapolation. Engineering progress is most valuable when it expands a known response range, reduces a quantified artifact, or introduces an independent observable.
Recent Consensus
Quantitative RNA measurements are conditional on analyte definition and workflow. The field increasingly treats calibration placement, assay efficiency, blank distributions, replicate hierarchy, and complete metadata as integral to interpretation. RT-qPCR reference genes require empirical validation. Digital PCR improves partition-based absolute inference but does not remove reverse-transcription or sampling bias. Fixed-cell single-molecule counting requires detection-efficiency and overlap controls. Live-cell reporters require explicit tests of RNA function, abundance, processing, and lifetime. Orthogonal evidence should be chosen by failure mode rather than by convenience.
Open Questions, Controversies, Deprecated Models, and Common Misconceptions
Open questions:
- How can universal reference materials represent endogenous RNA structure, modifications, ribonucleoprotein state, and matrix effects without becoming assay-specific?
- Which live-cell tagging strategies give sufficient brightness while minimally changing endogenous RNA fate across diverse cell types?
- How should detection limits be standardized for spatial assays with nonuniform tissue background and segmentation-dependent calls?
- How can molecule-counting pipelines report transferable uncertainty across microscopes, laboratories, and biological morphologies?
- When do programmable endogenous RNA binders perturb the very transport, translation, or decay state they are intended to observe?
Controversies:
- Claims of absolute RNA copy number remain method-dependent when calibrants bypass extraction, reverse transcription, accessibility, or cell-count uncertainty.
- The label “single molecule” is sometimes applied to diffraction-limited objects without sufficient evidence that one object corresponds to one intact RNA.
- Automated denoising and super-resolution inference can improve visibility while also obscuring whether features originate in photons or learned priors.
Deprecated or weakened claims:
- One housekeeping gene can serve as a universal normalization reference.
- A low Cq or positive digital partition proves the presence of intact target RNA.
- One fluorescent spot necessarily equals one full-length RNA molecule.
Common misconceptions:
- “Digital PCR is calibration-free and therefore bias-free.” Digital partitioning removes the need for a continuous amplification standard curve, but occupancy modeling, partition volume, inhibition, molecular linkage, sampling, and reverse transcription still matter.
- “A Northern blot is qualitative.” Band intensity can be quantitative within a calibrated unsaturated range, although size-dependent transfer and hybridization must be controlled.
- “RACE directly reads the natural RNA end.” RACE reads products admitted by end chemistry, reverse transcription, adapter capture, and amplification.
- “More probes always improve FISH specificity.” Additional well-designed probes can increase signal, but homologous or repetitive probes can add structured background and partial targets remain detectable.
- “A smooth live-cell trajectory proves motor transport.” Diffusion, confinement, drift, tracking errors, and optical sampling can create smooth or directional-looking paths.
- “Orthogonal validation means repeating the result with another platform.” The confirming method should test a different physical consequence and avoid the dominant artifact of the first assay.